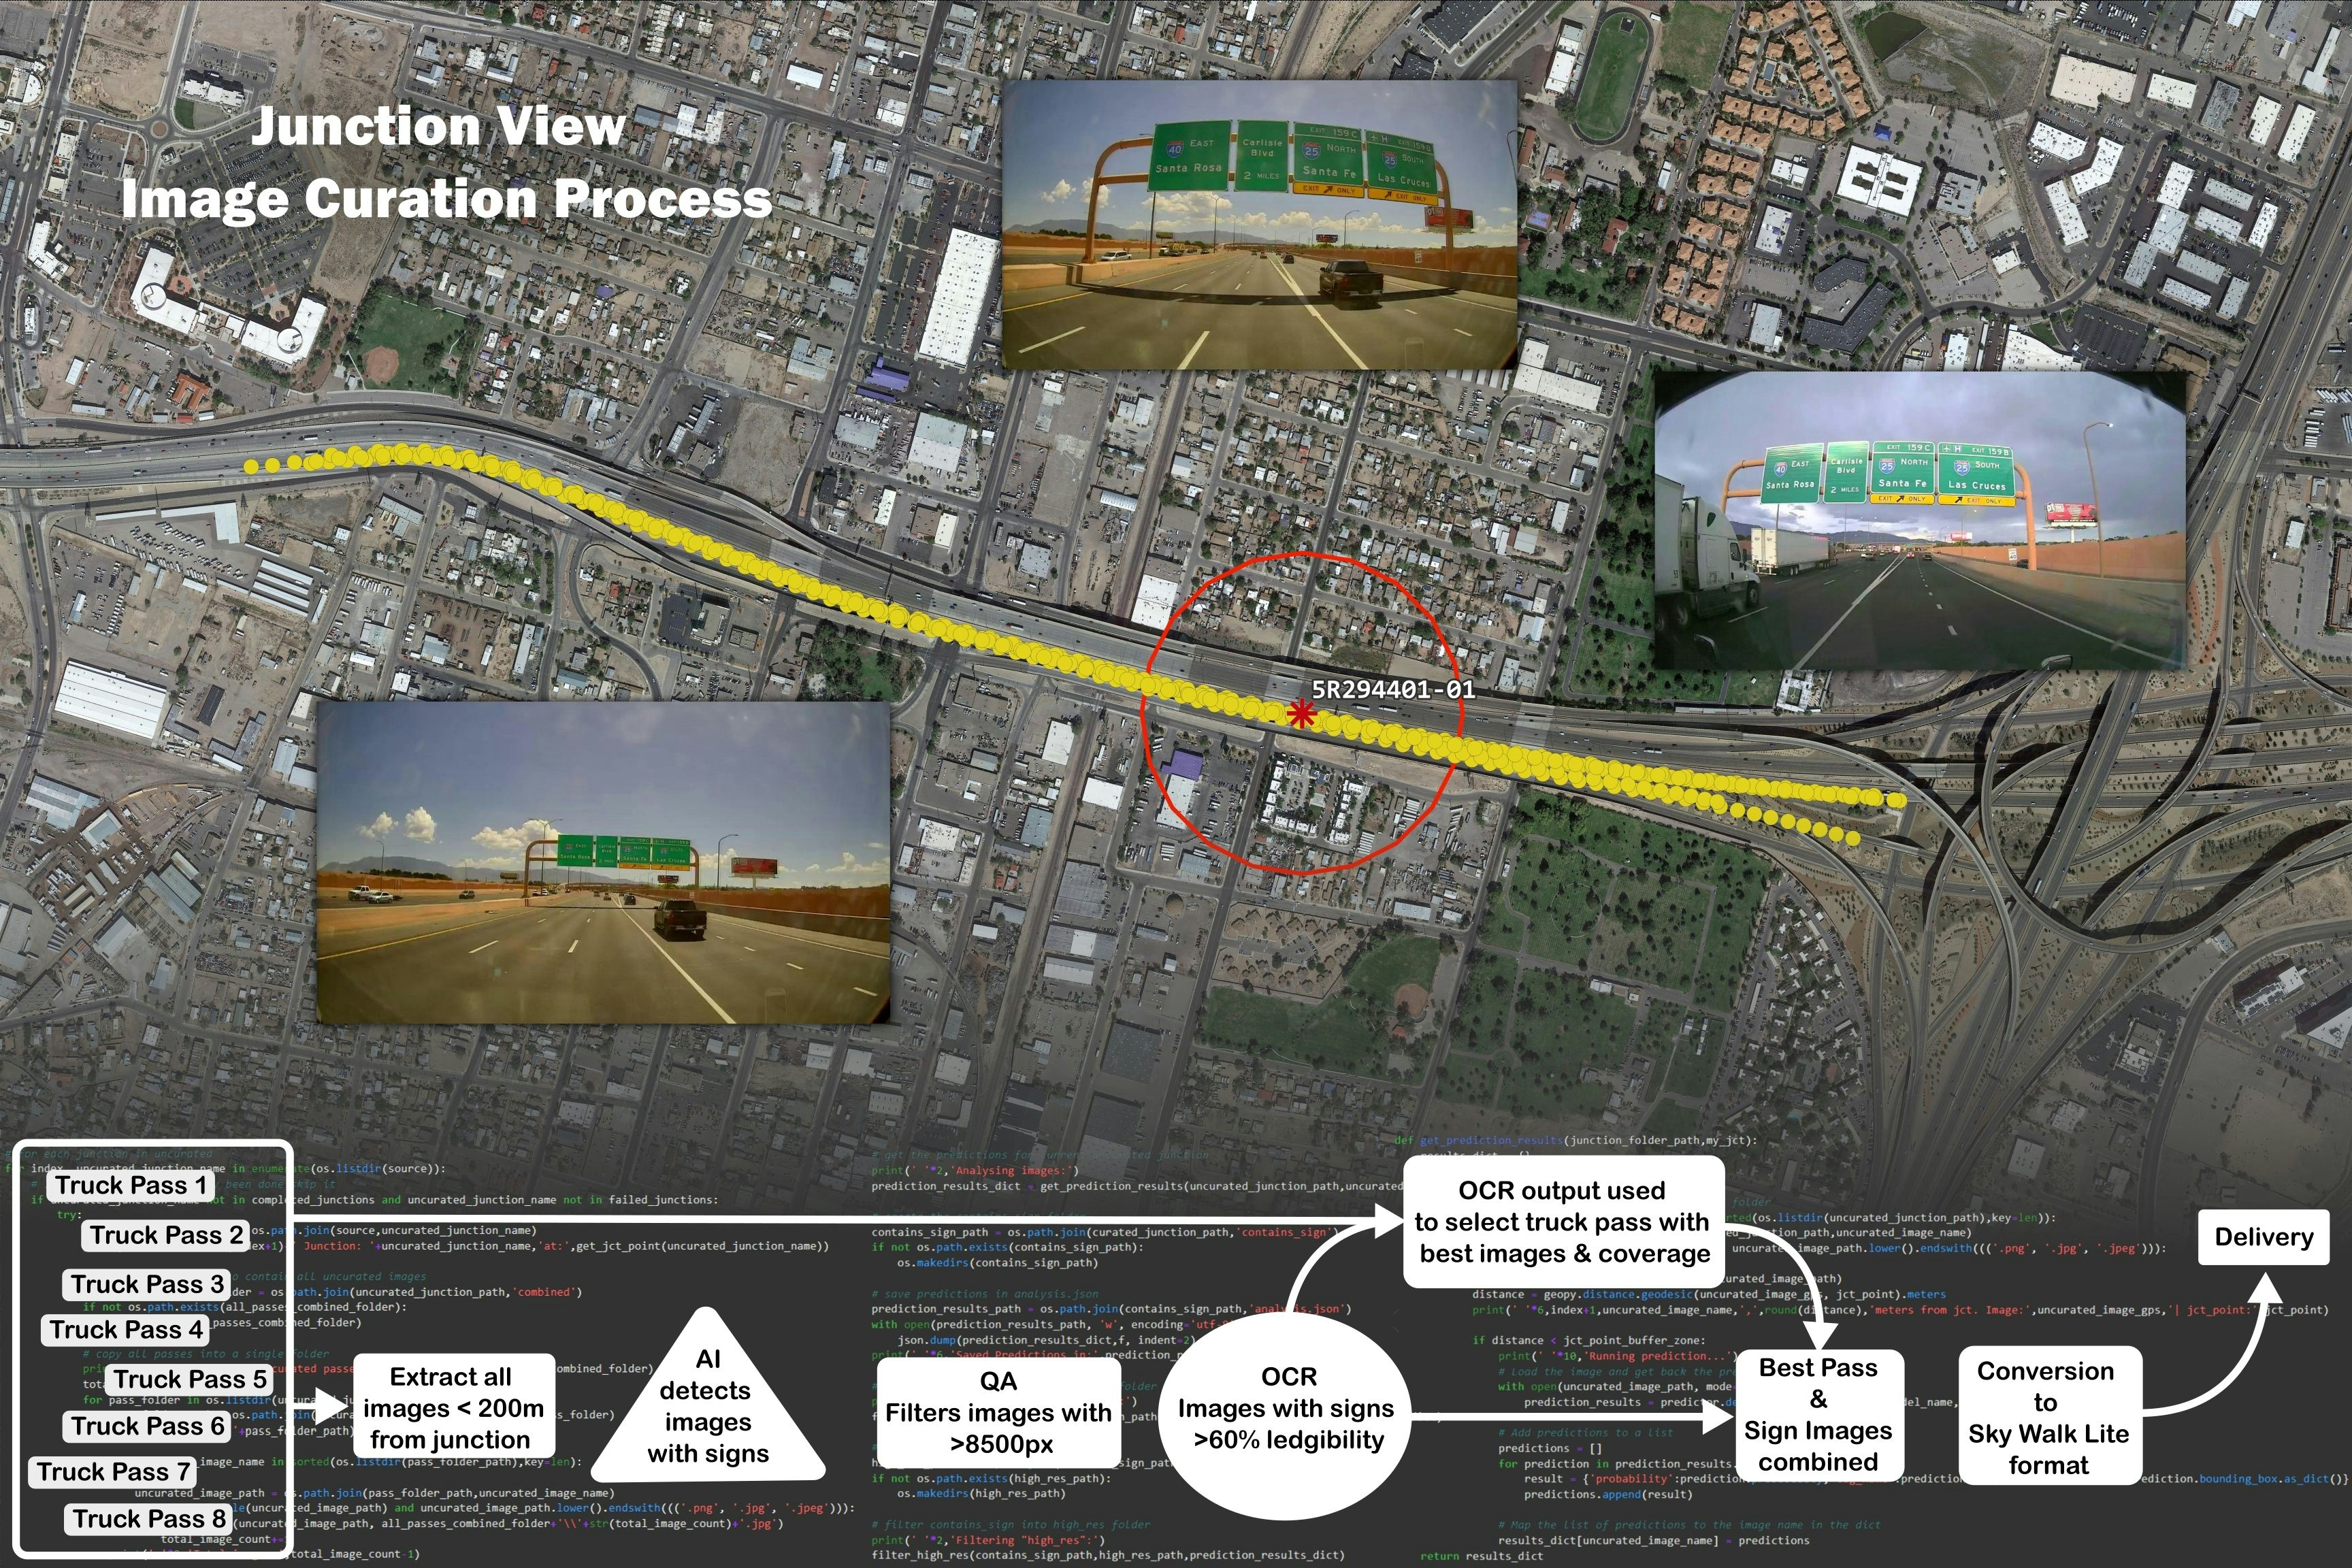
This is a visualization of an AI image curation process to find the optimal sign images on US/CAN higways. This was printed as a poster for presentation of the project.
Yellow points represent images taken on the highway. The red circle is a 200m radius around the decision point of the highway. Sample sign images are represented to show the AI's selection from the group of images.