INTRODUCTION:
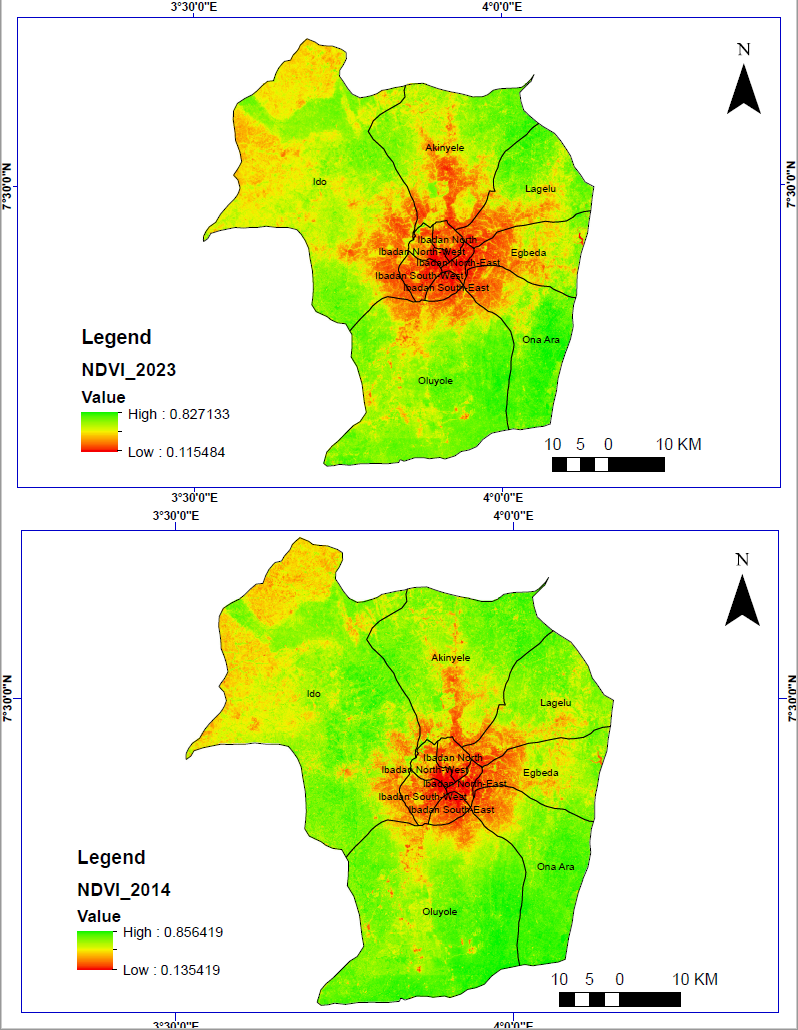
This analysis aims to assess changes in the vegetation health of Ibadan city using Normalized Difference Vegetation Index (NDVI) data. This analysis aims to compare and access the extent of vegetation growth and greenness (i.e healthiness of vegetation in Ibadan).NDVI analysis is used in agriculture, forestry, and ecology to monitor the growth and health of a plant, and vegetation and to identify areas of stress or damage. NDVI values can also be used to map and classify vegetation types, and to detect changes in vegetation cover over time. The index value ranges from -1.0 to 1.0, where negative values are mainly formed from clouds, water, and snow, and values close to zero are primarily formed from rocks and bare soil. small values 0.1 or less of the NDVI represent areas of rocks, sand, or snow. While values from 0.2 to 0.3 represent shrubs and meadows, while large values from 0.6 to 0.8 indicate temperate and tropical forests.
DATA SOURCES:
The GeoTIFF data of Ibadan was obtained from Landsat-8 satellite imagery for 2014 and 2023. Data were downloaded in .tif format from the USGS (United State Geological Survey) website.
PRE-PROCESSING:
The data were pre-processed using the SCP plugin in QGIS to apply atmospheric correction in other to prepare the data for further analysis. GeoTIFF format and reproject it to a standard coordinate system. The data was then filtered to exclude cloud cover and other data artifacts.
ANALYSIS/ METHOD USED:
The raster data was imported into ArcMap and analyzed. NDVI values were calculated for each year using the raster calculator. The trends in NDVI over time were analyzed.NDVI is derived from satellite imagery and calculated by the formula:
NDVI = NIR- RED/ NIR + RED
Where:
NIR – light reflected in the near-infrared spectrum (Band 5 in Landsat 8)
RED – light reflected in the red range of the spectrum (Band 4 in Landsat 8)
RESULTS:
The analysis showed a significant decrease in vegetation over time in most regions. The results were visualized using maps. The results suggest that vegetation has diminished in most regions over the past decade, likely due to changes in land use, Urbanization, and climate.
CONCLUSION:
This analysis provides valuable insights into the long-term trends in vegetation health using NDVI data.