
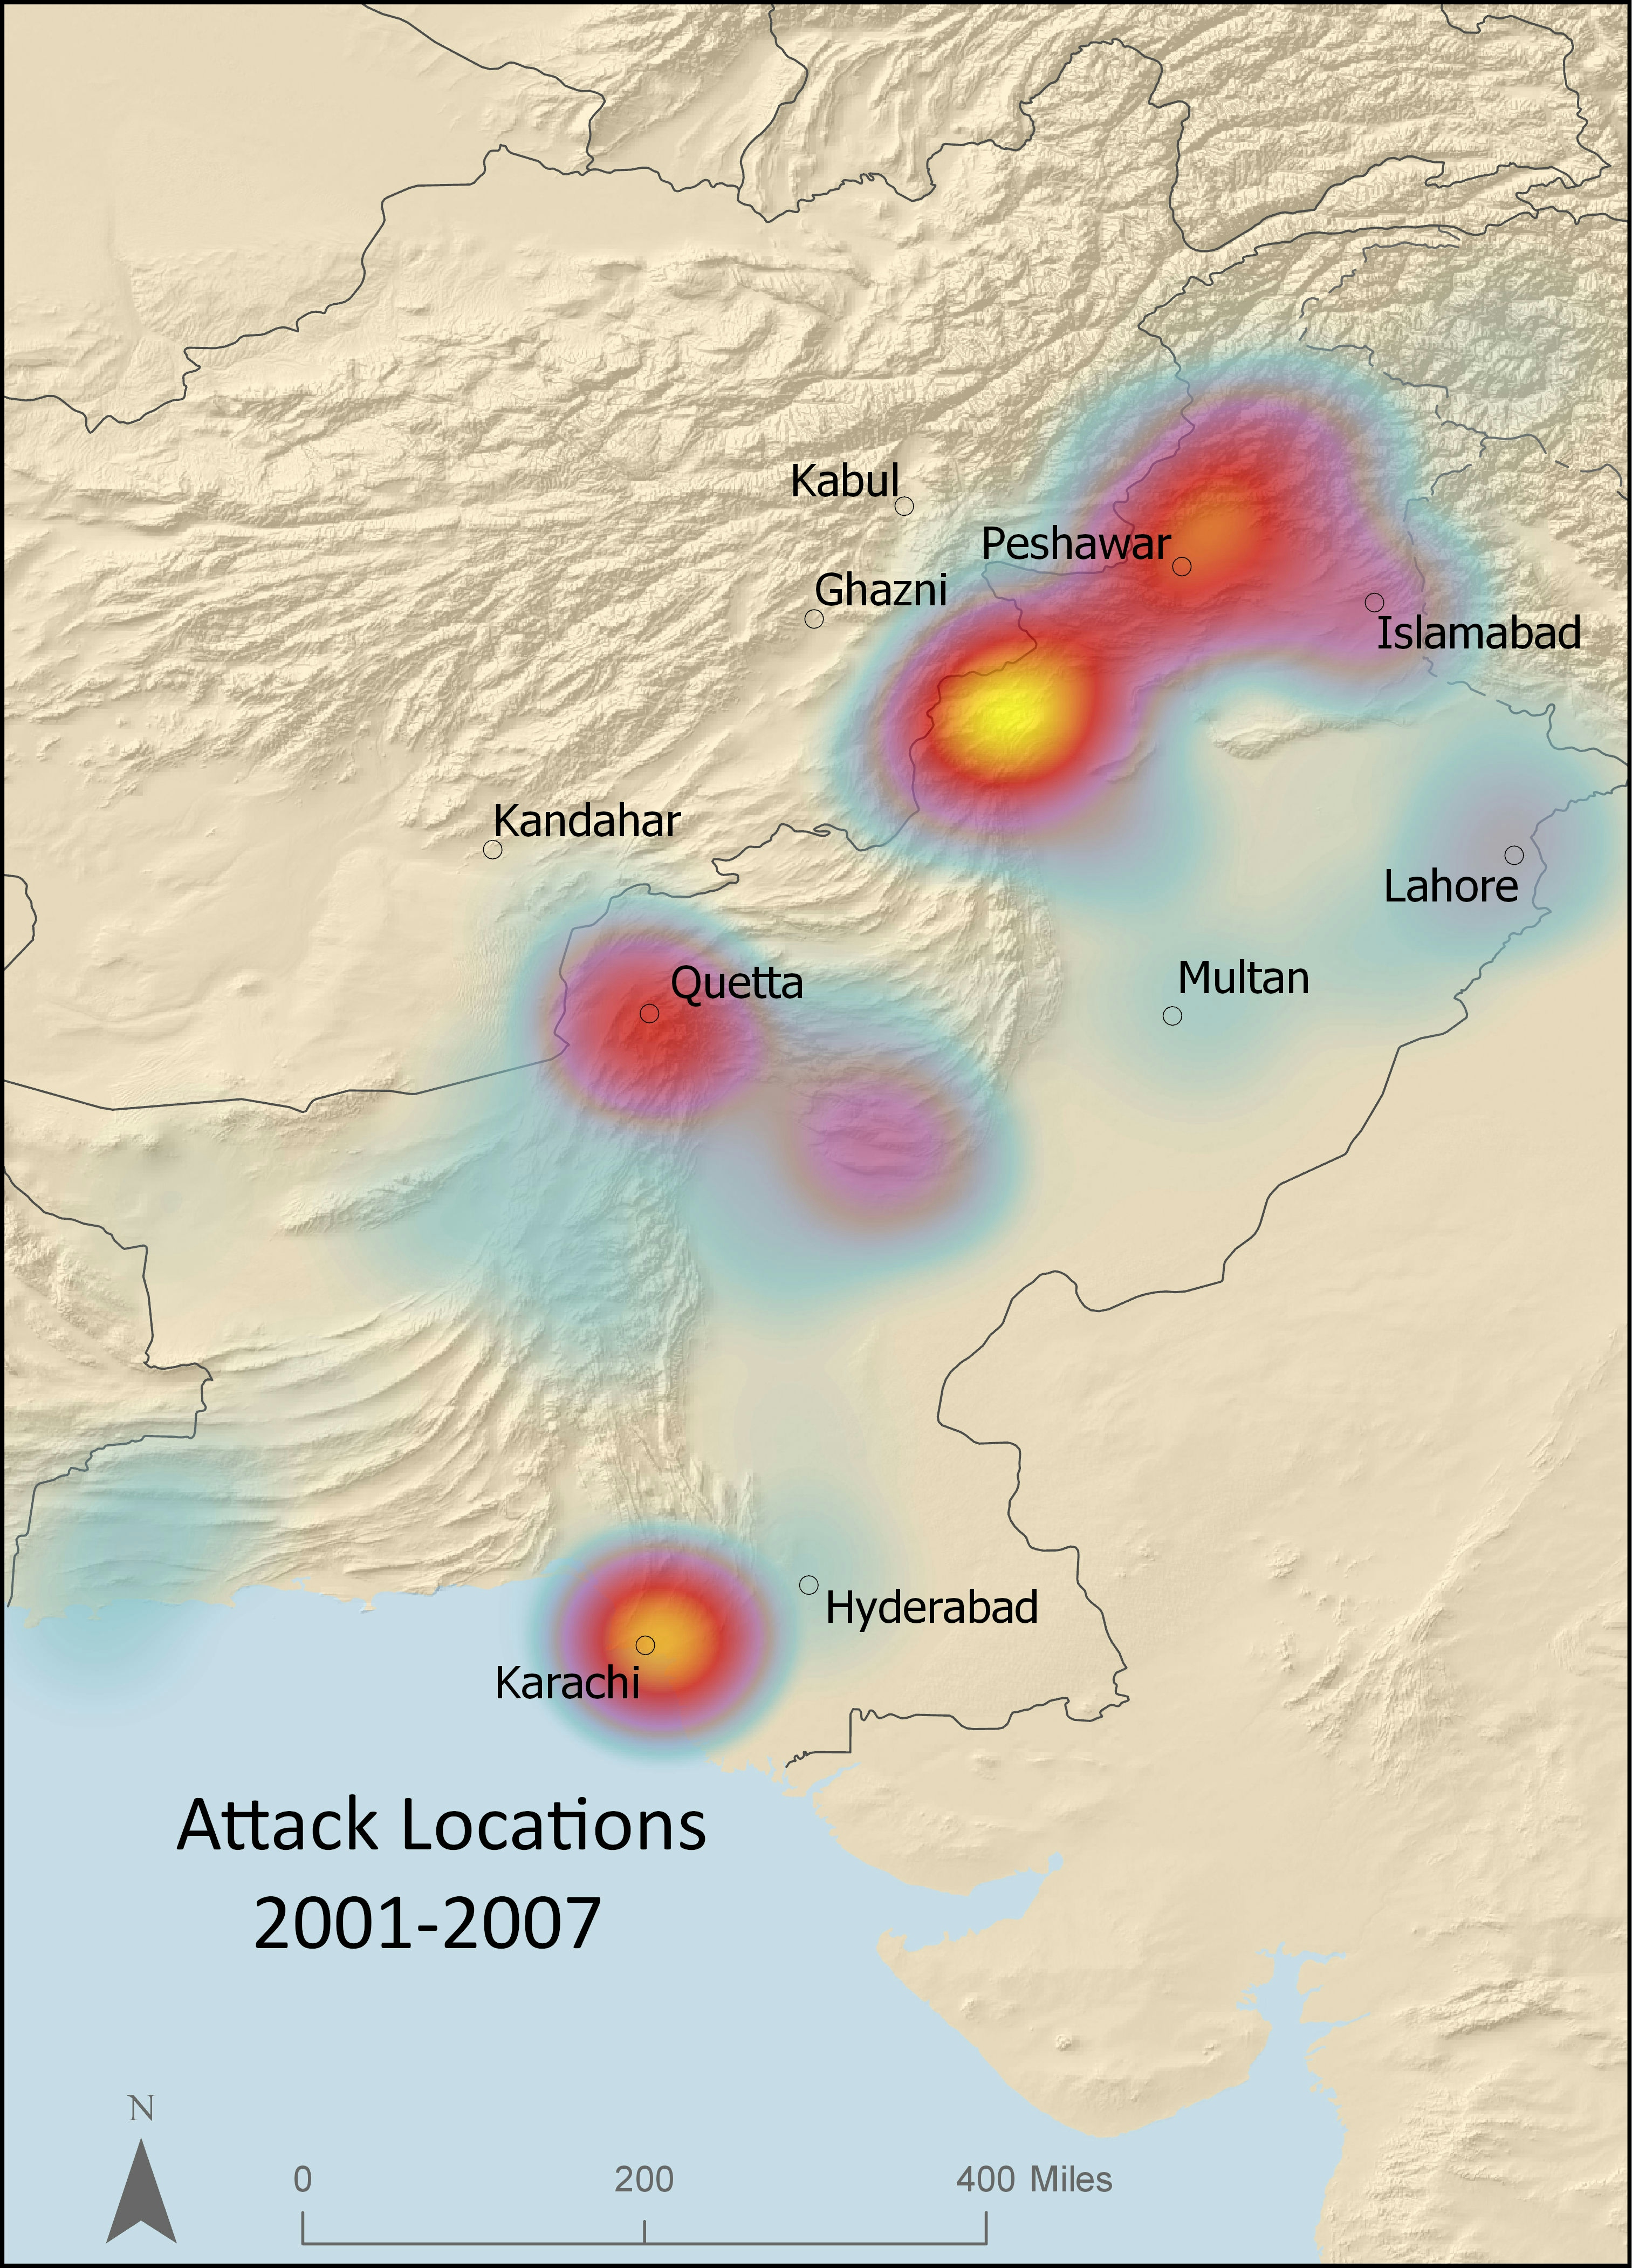
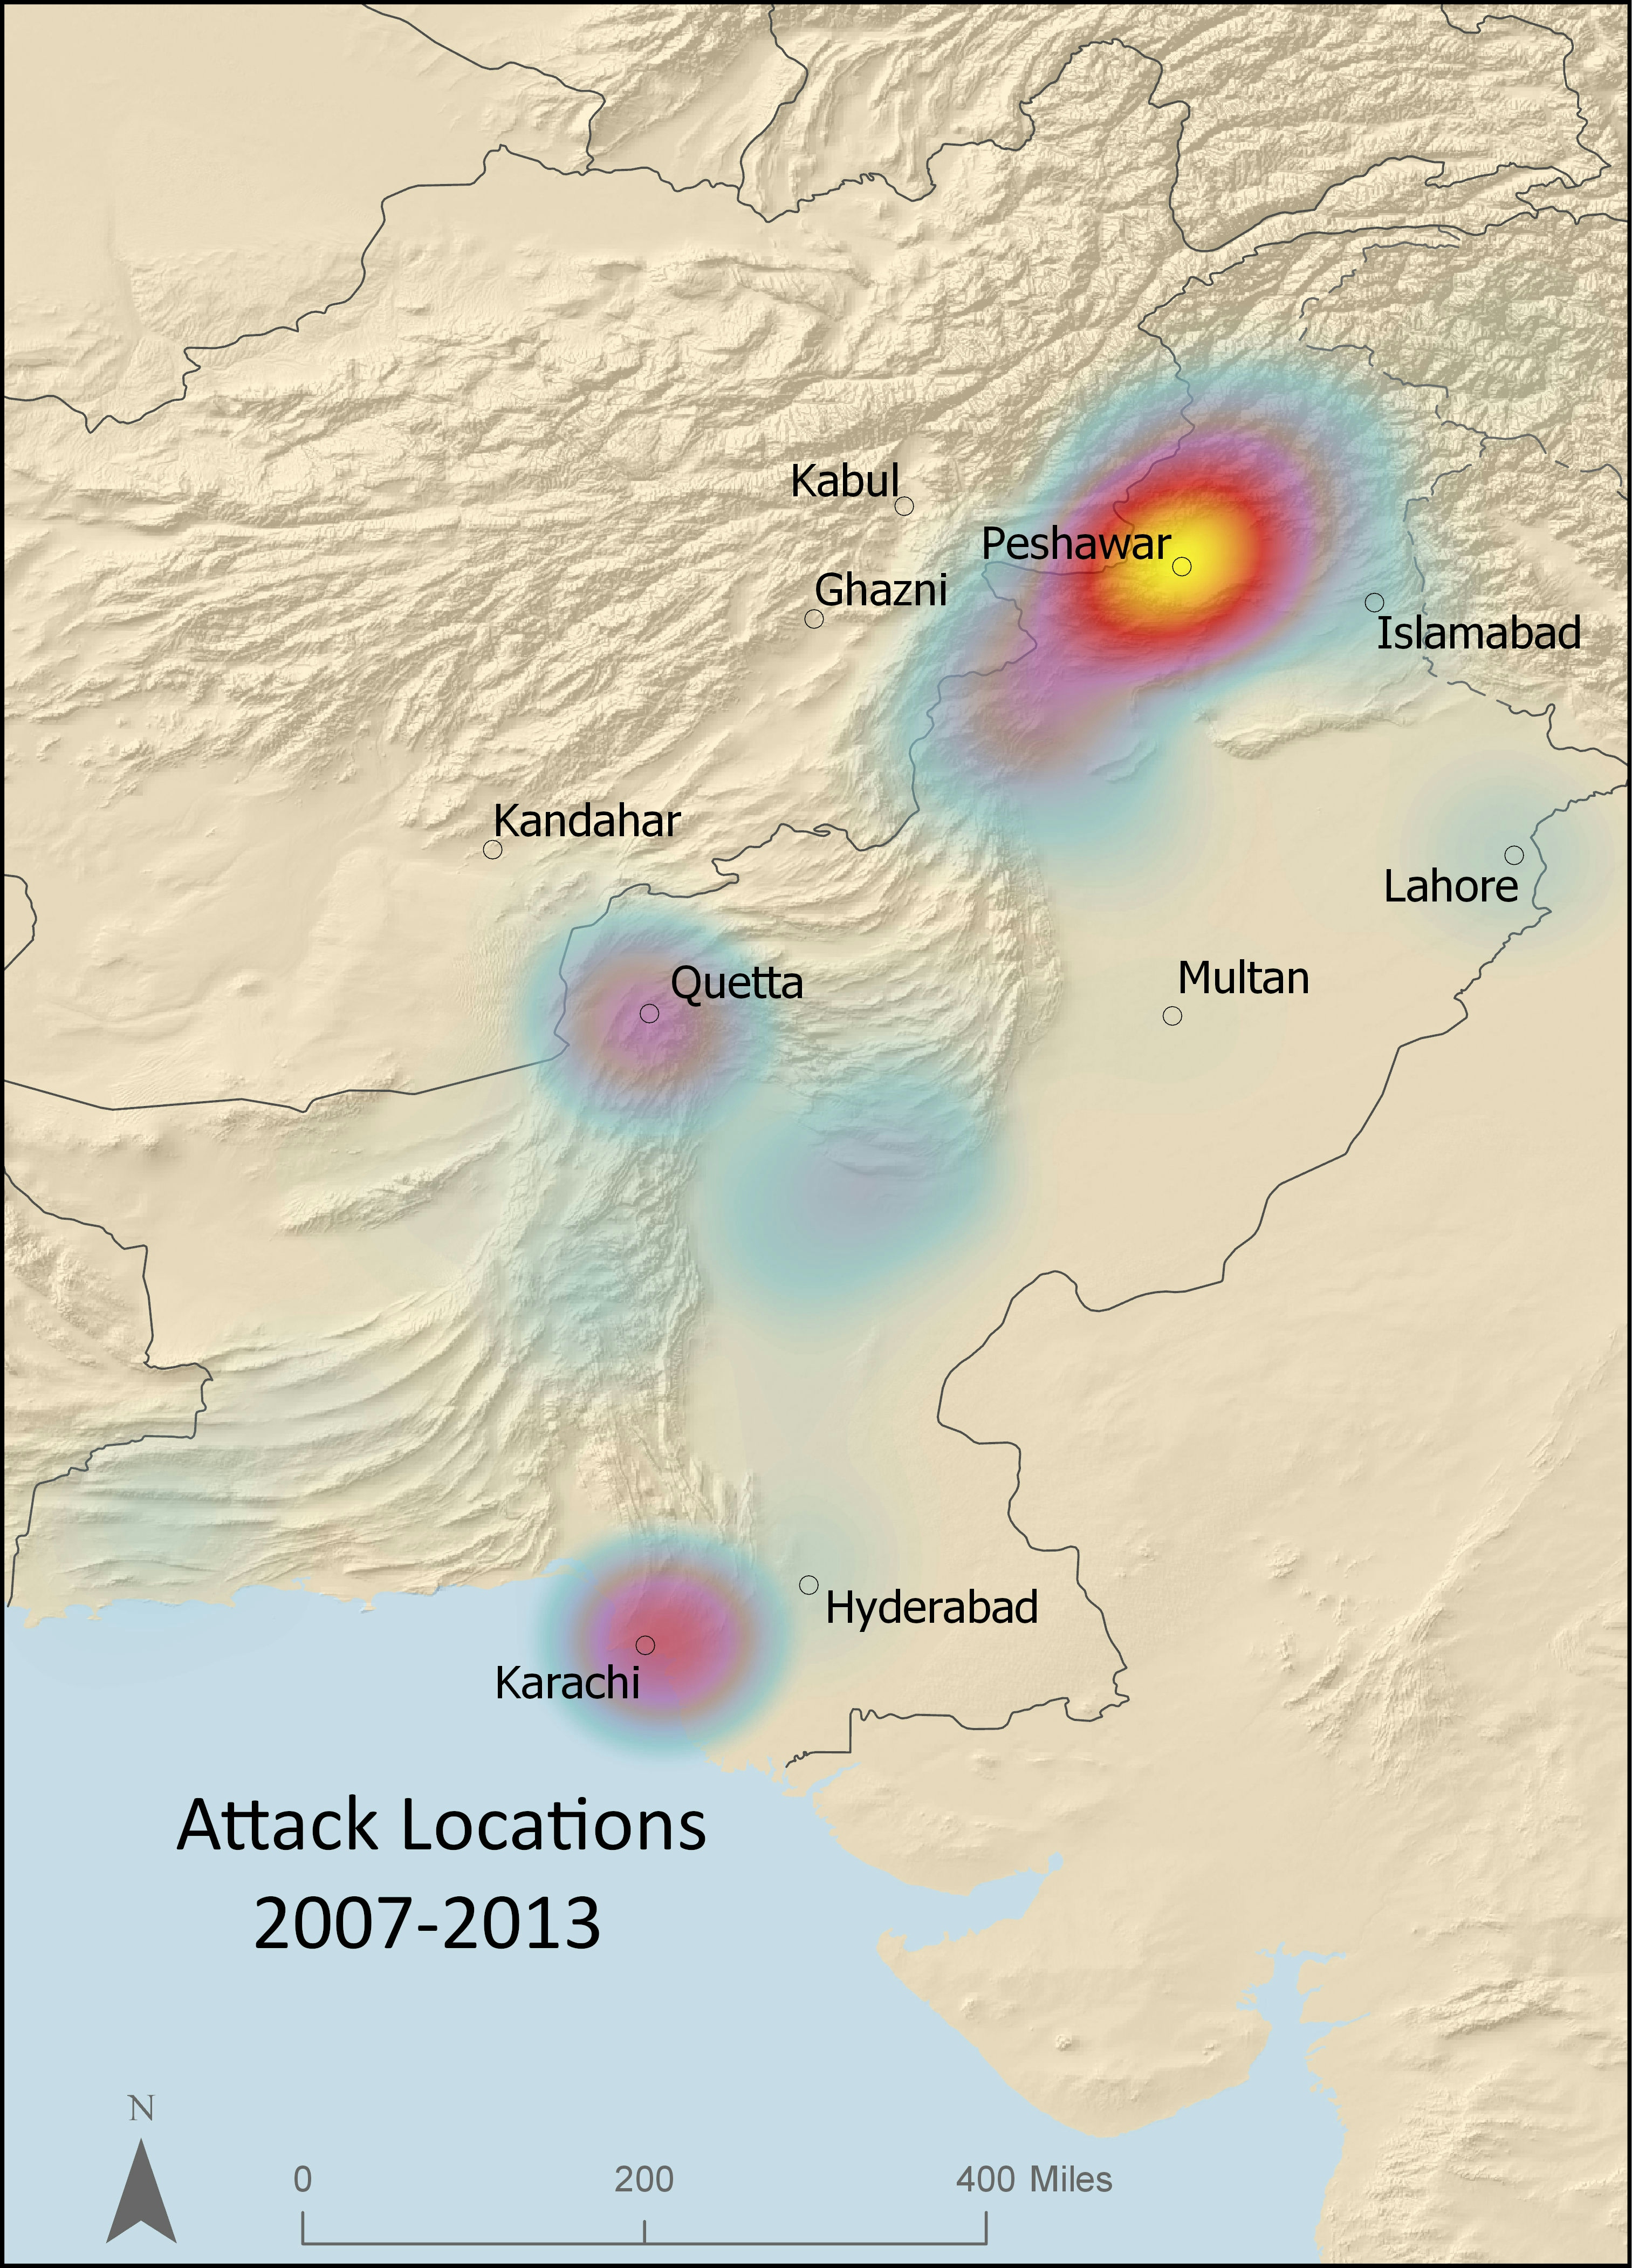
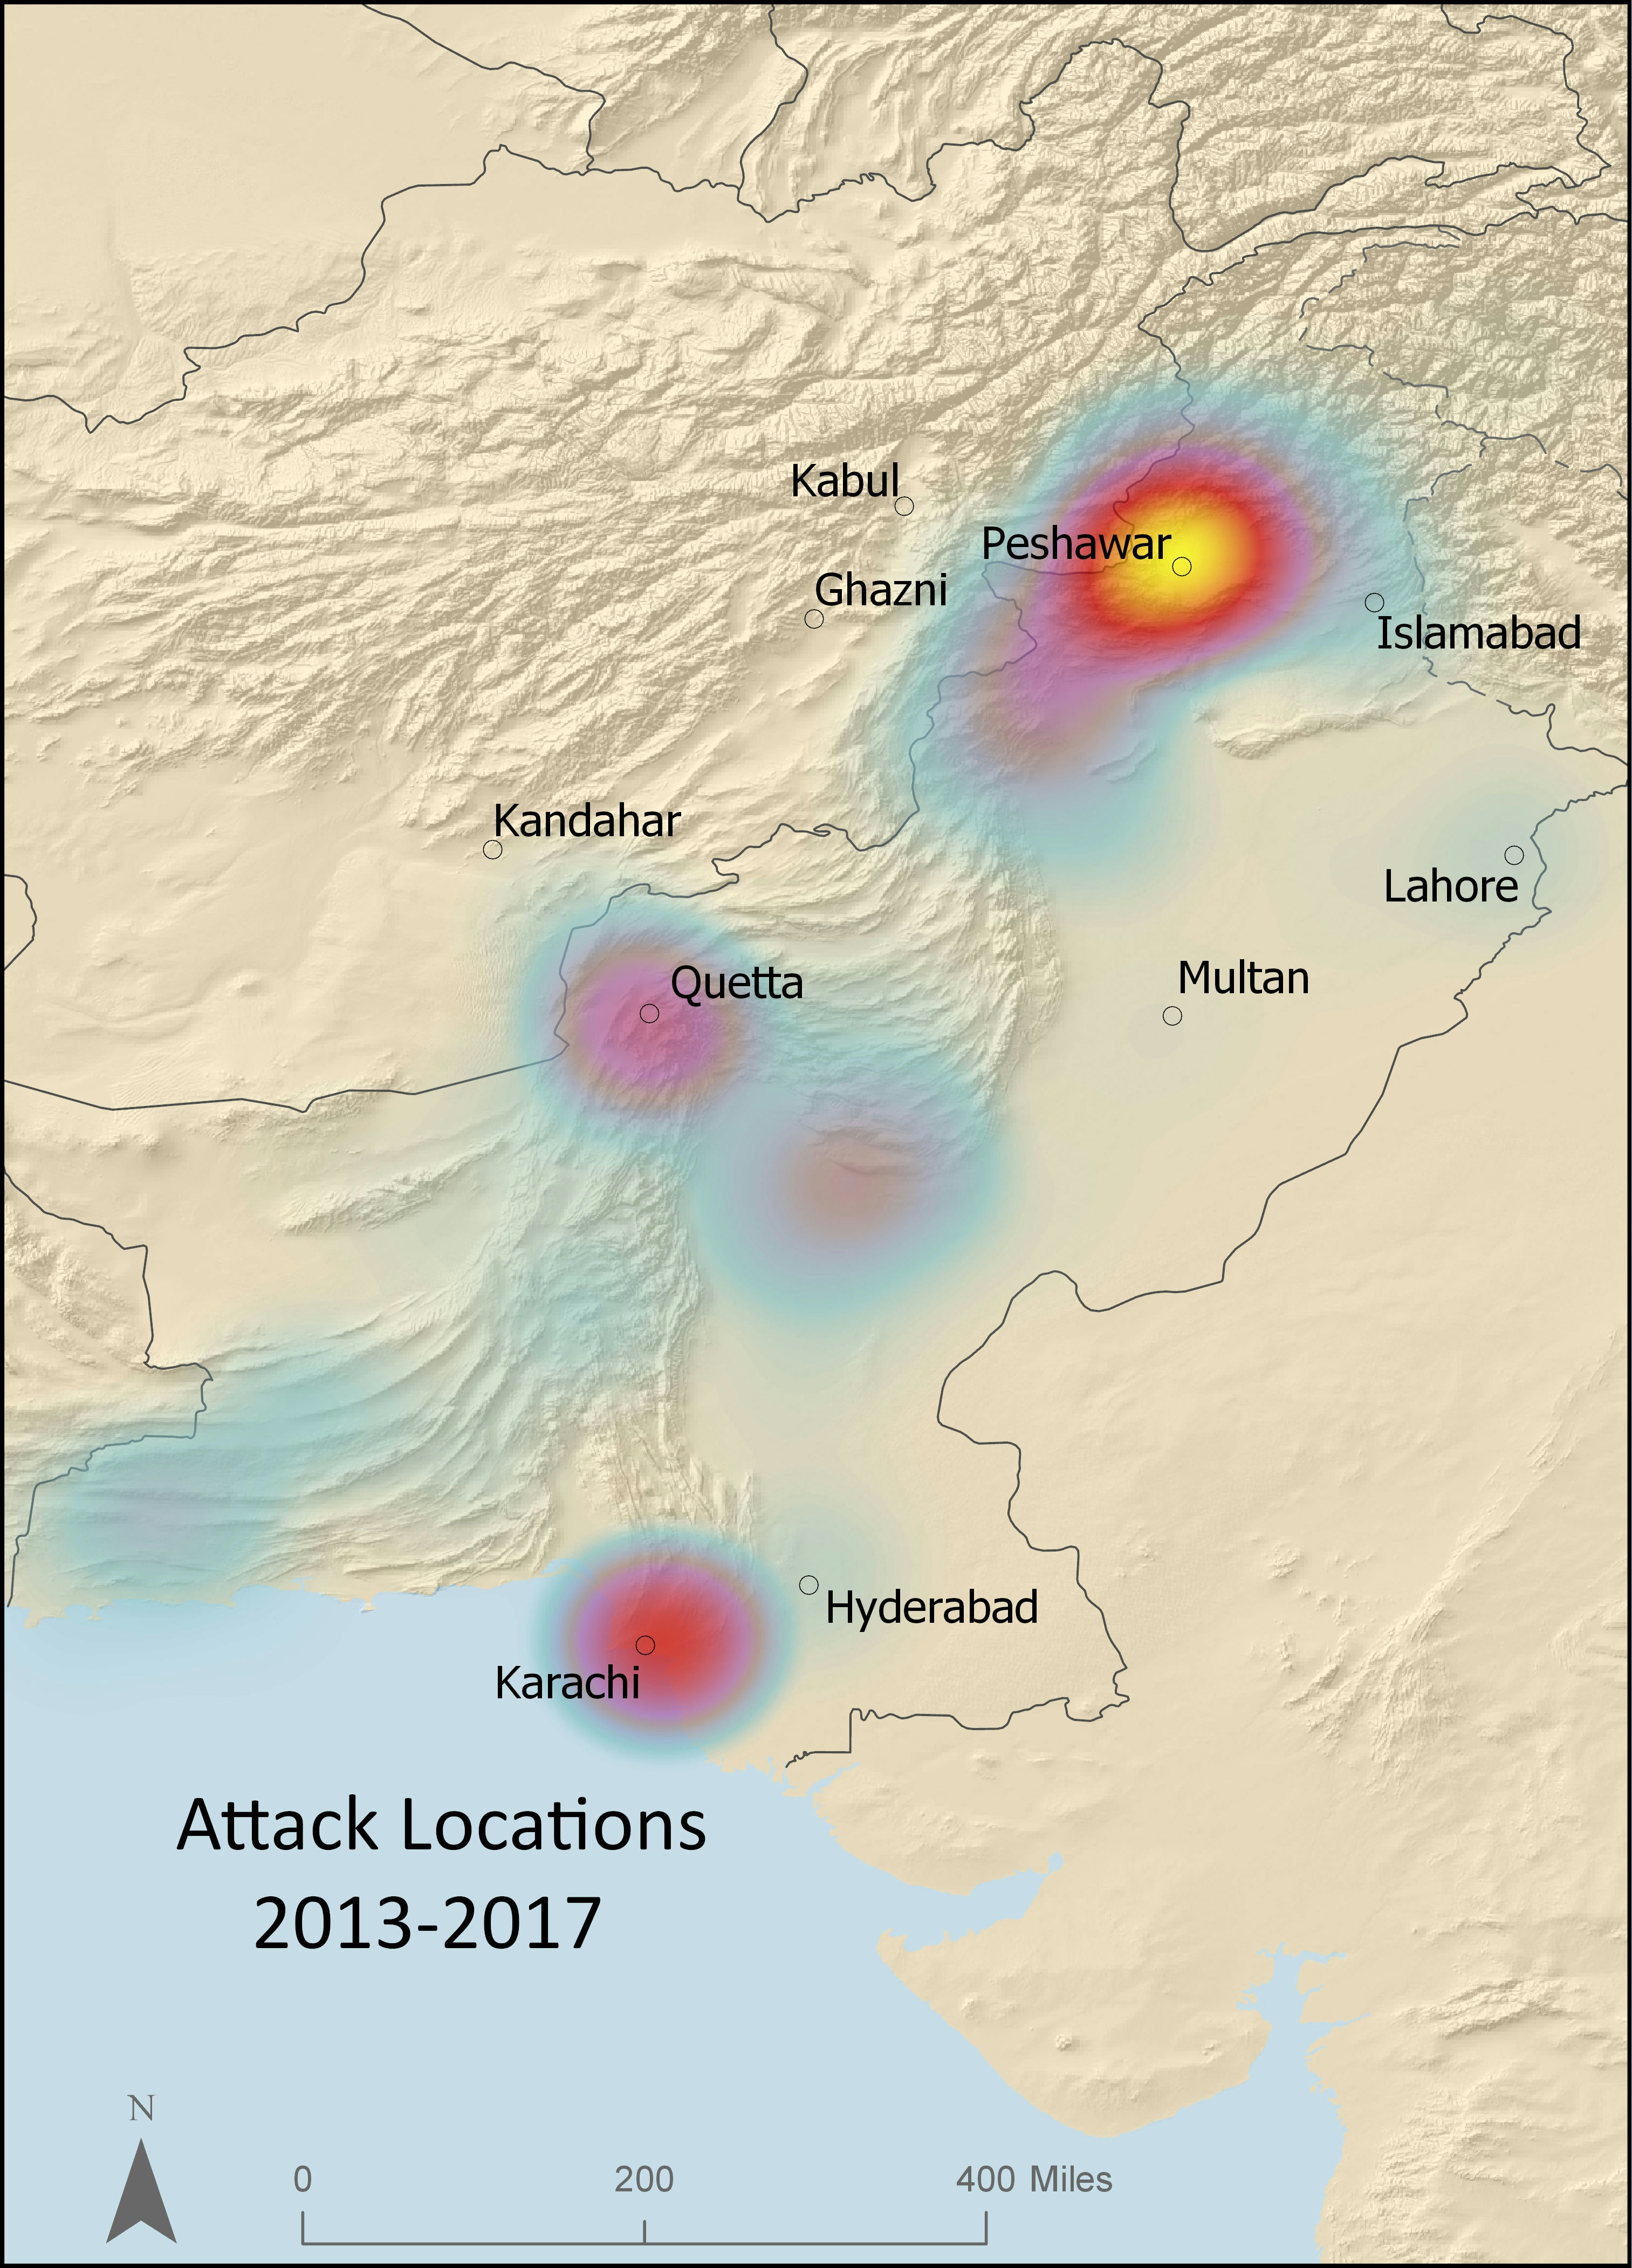

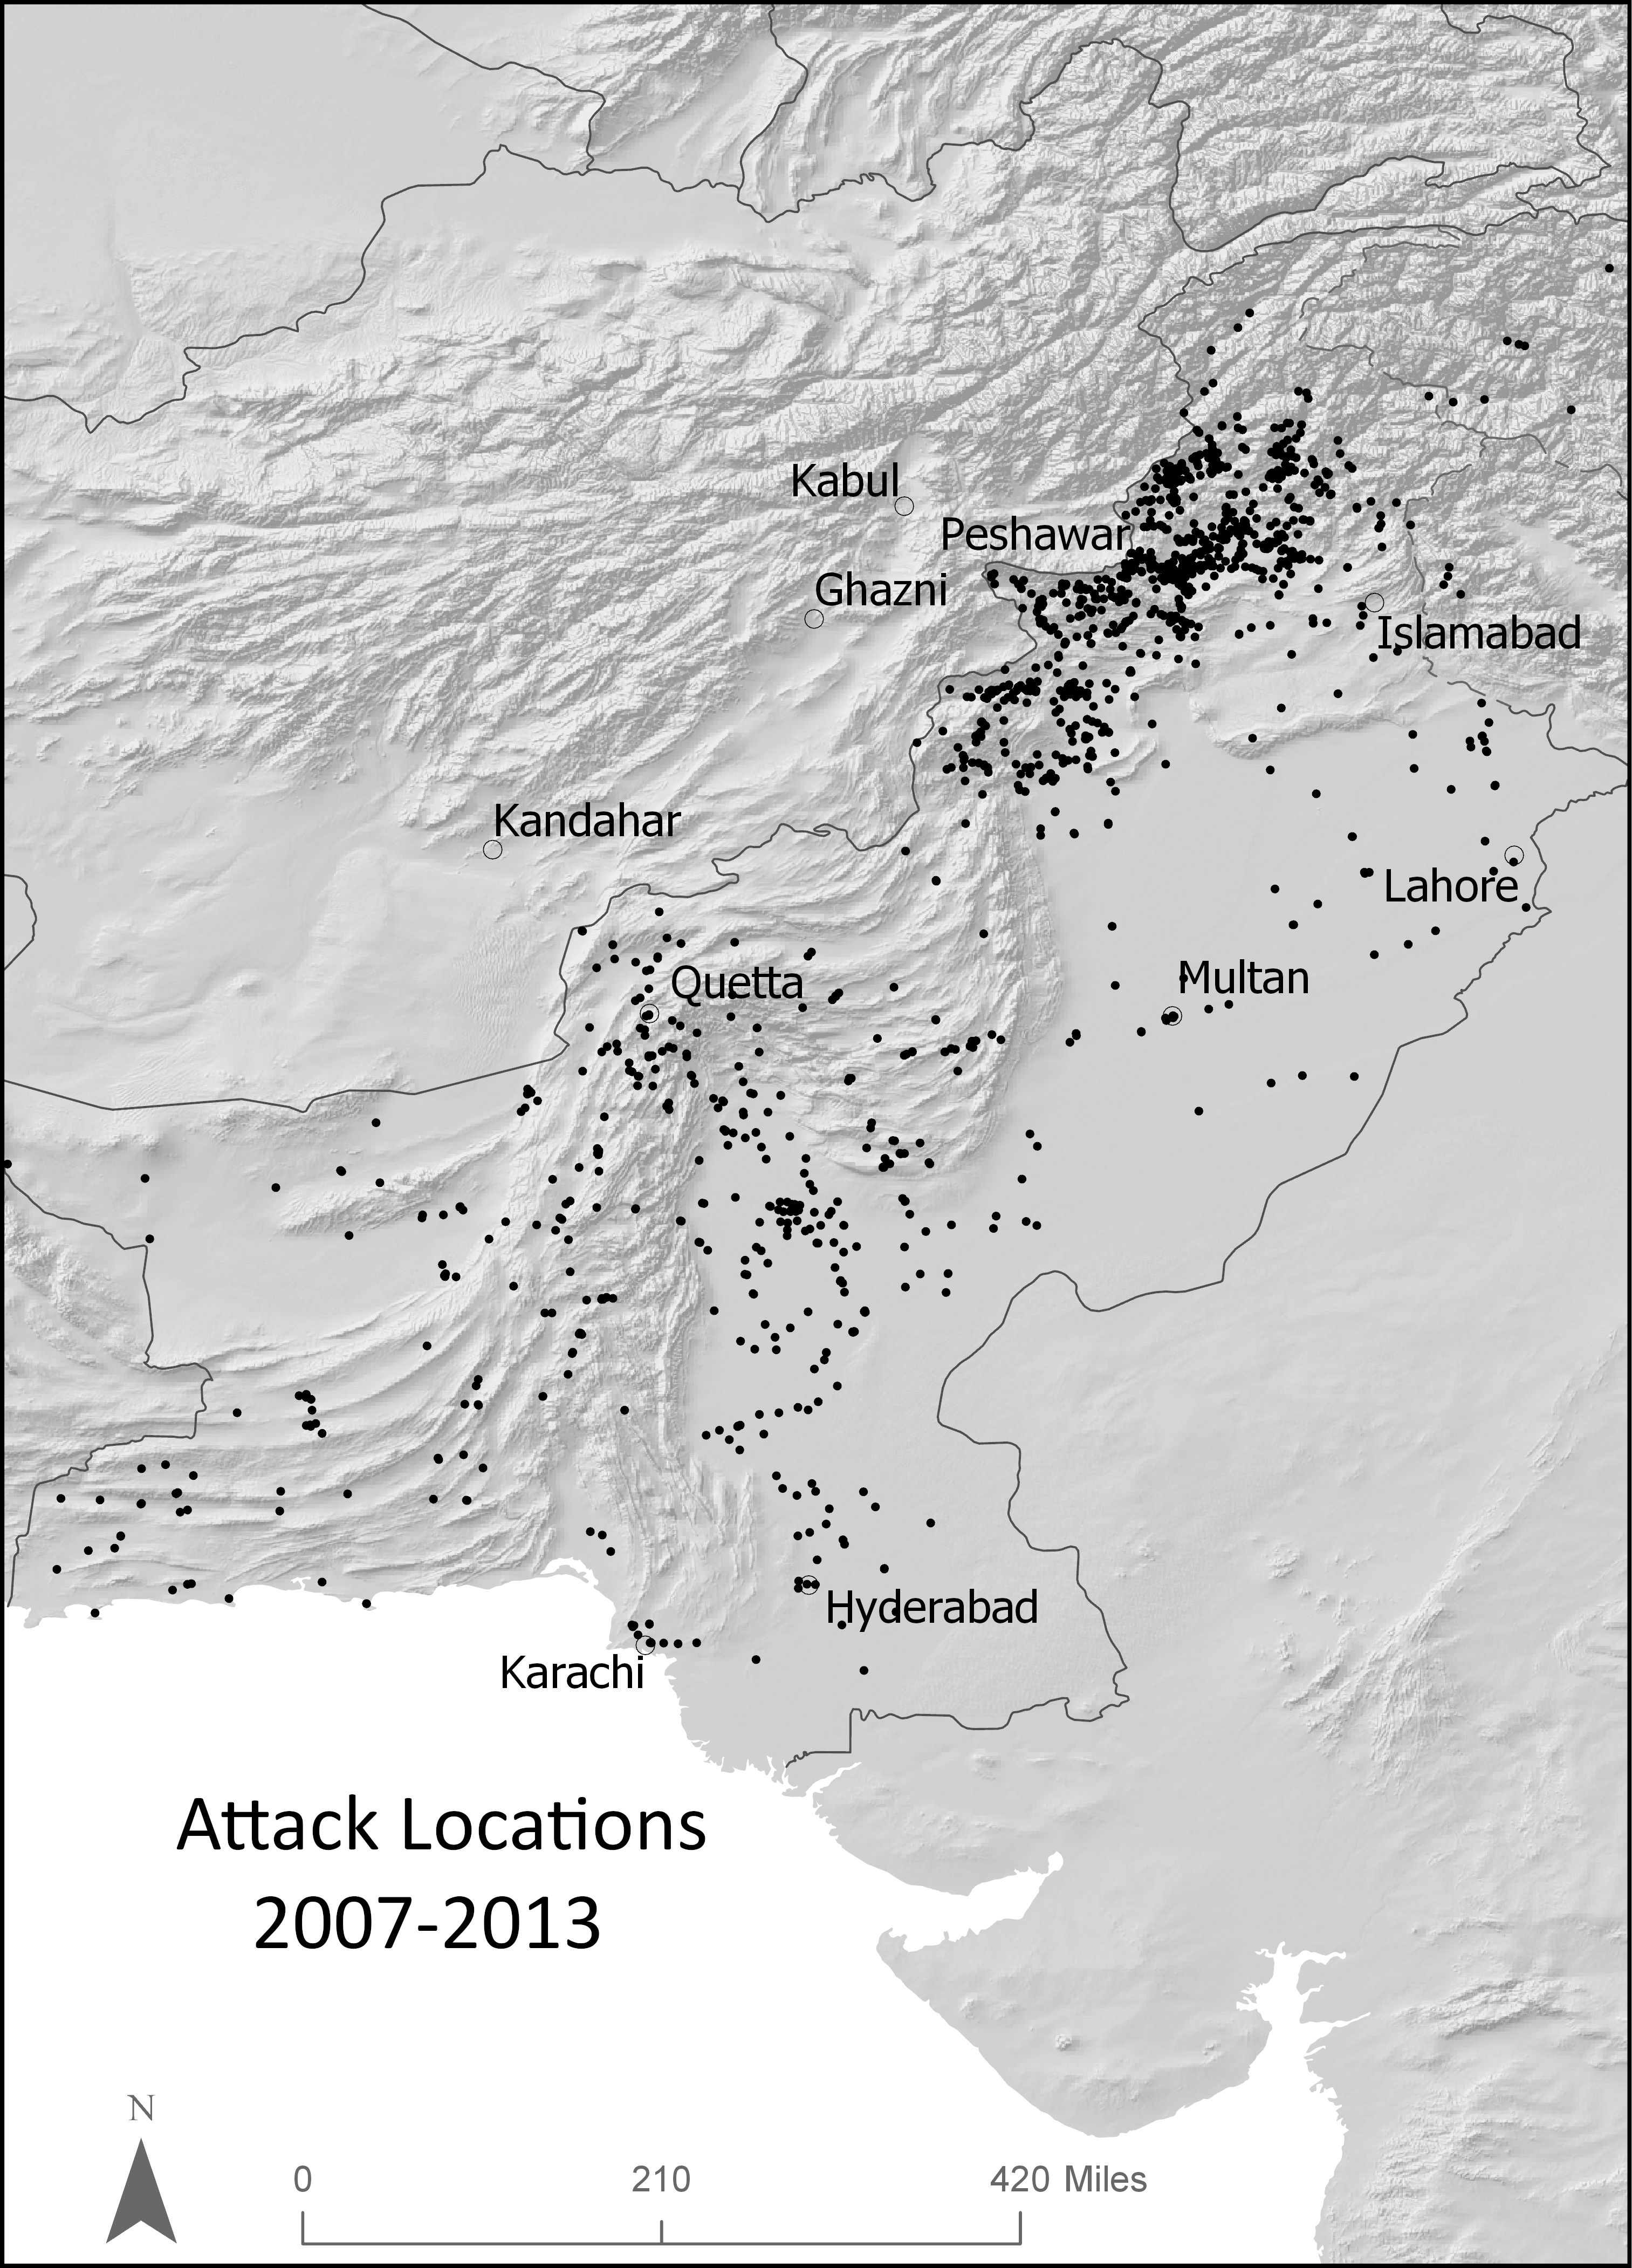
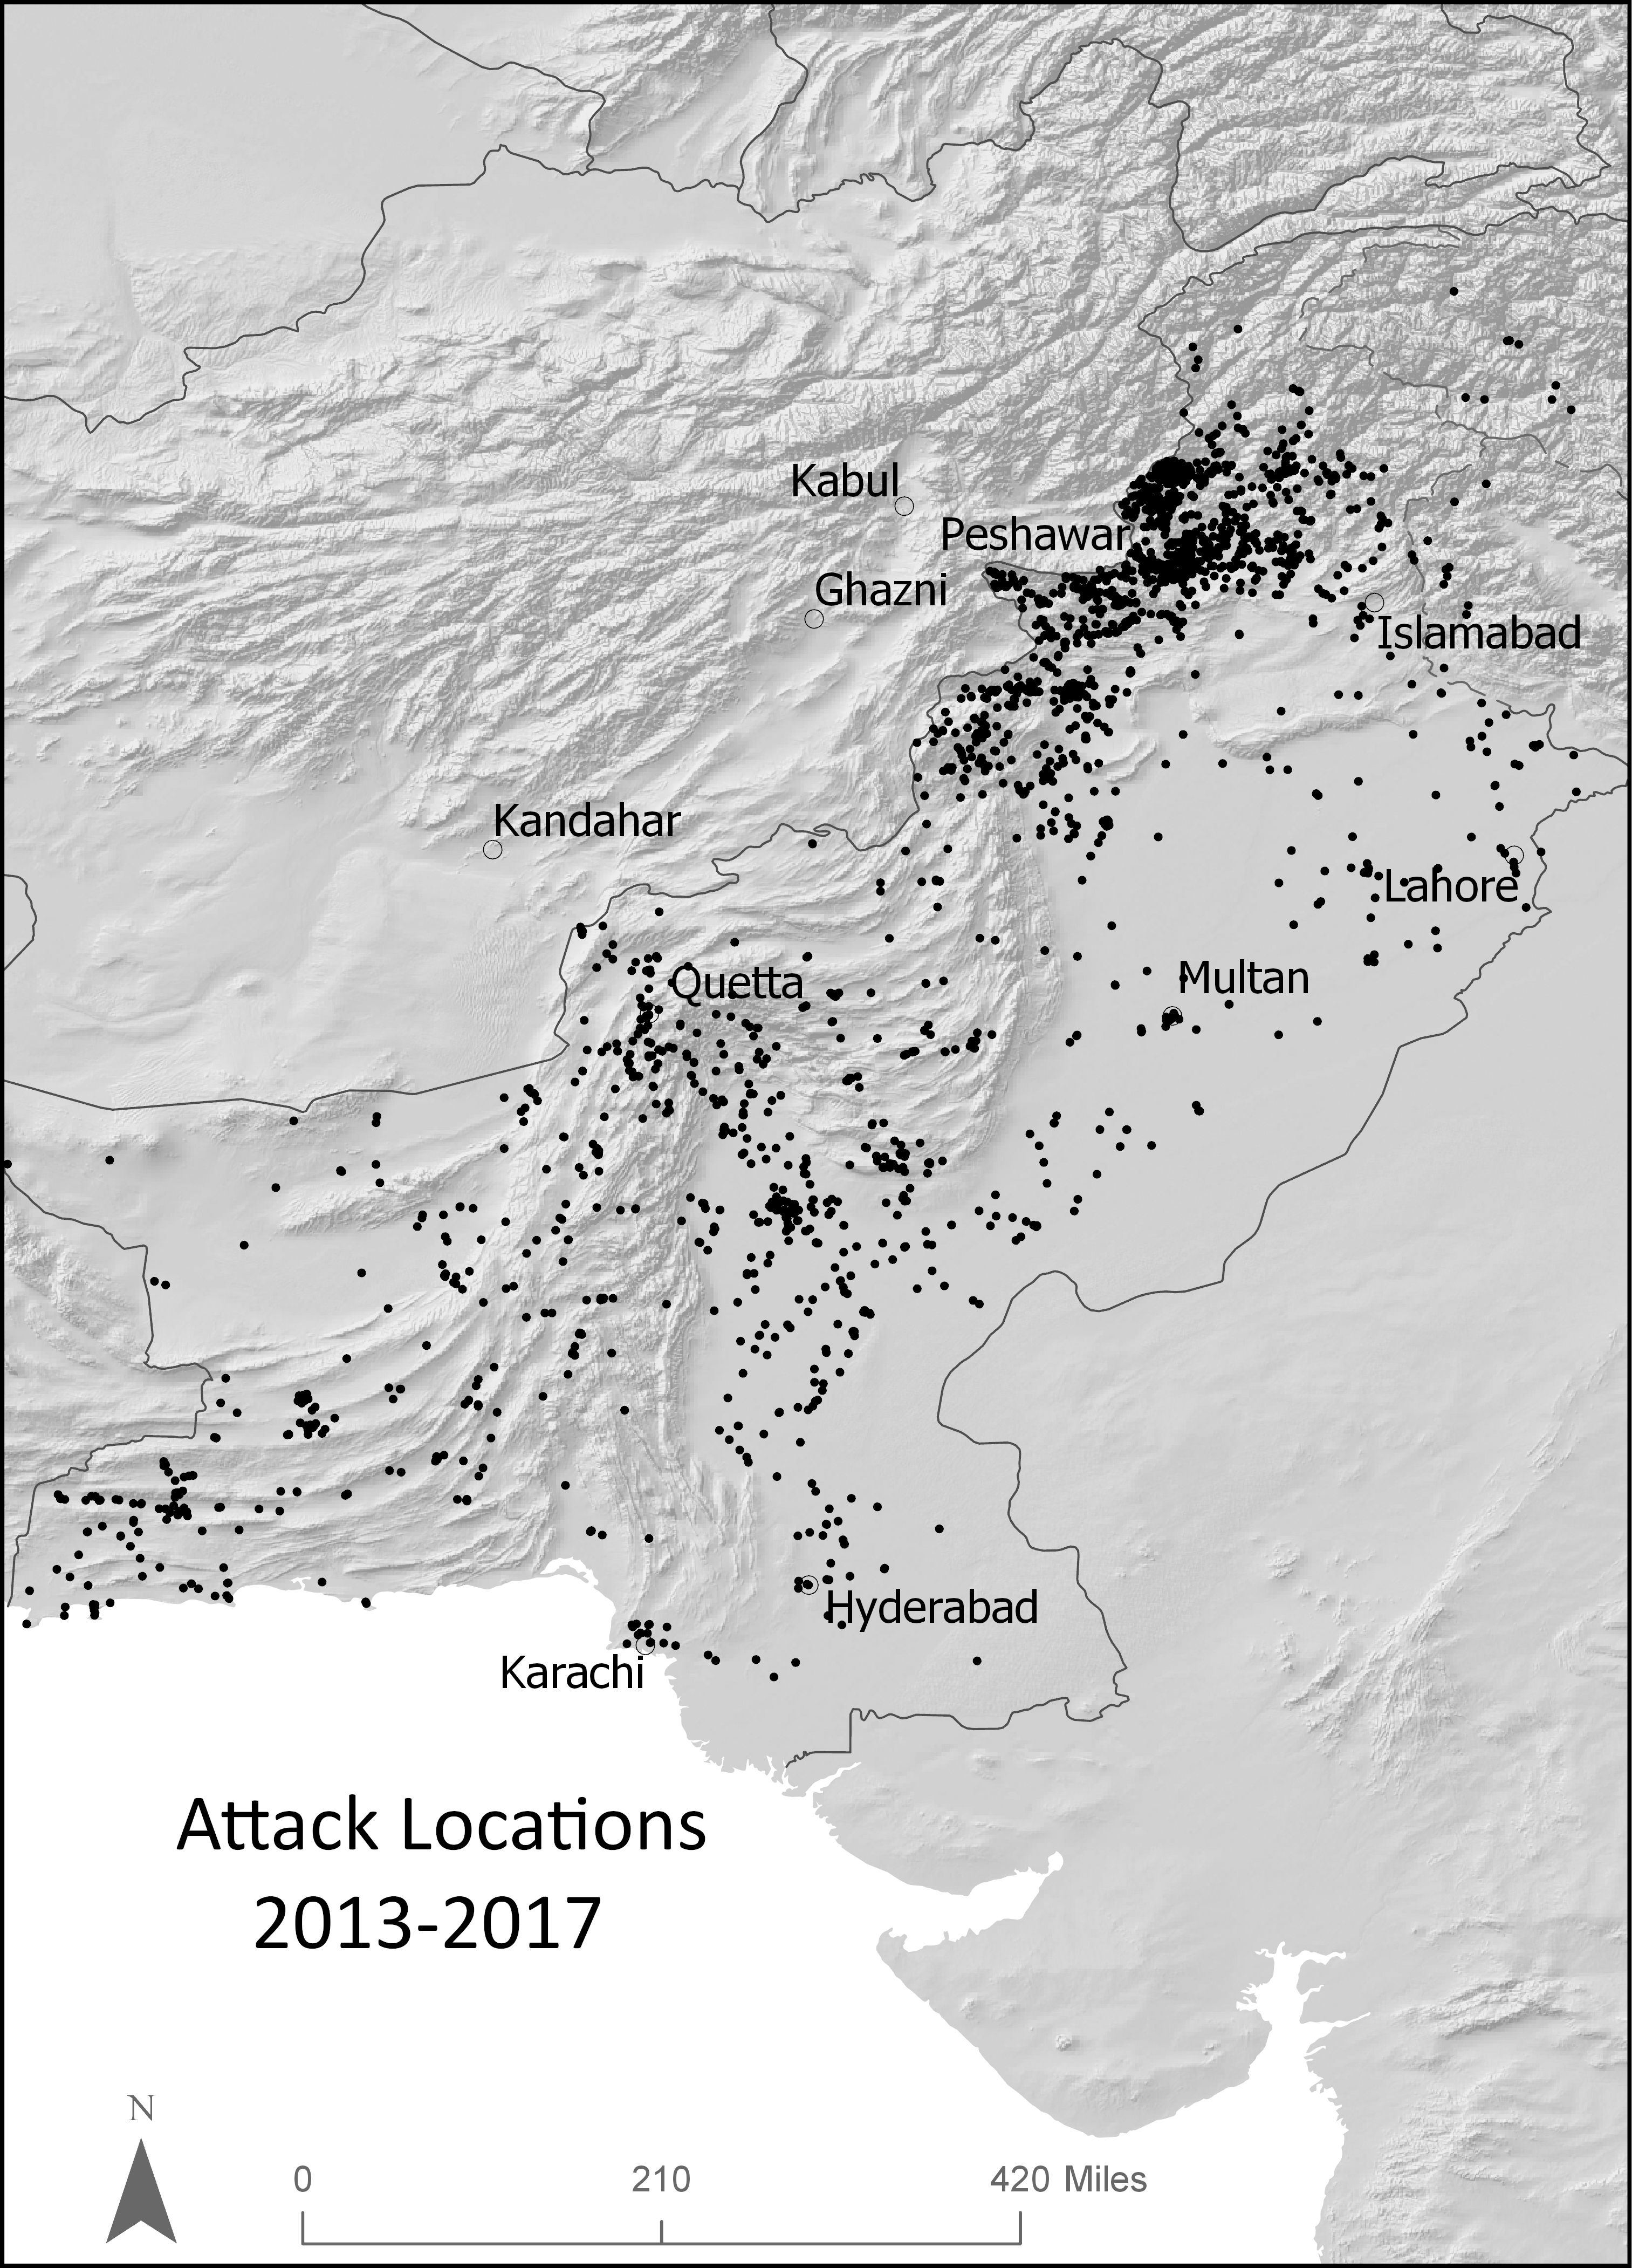
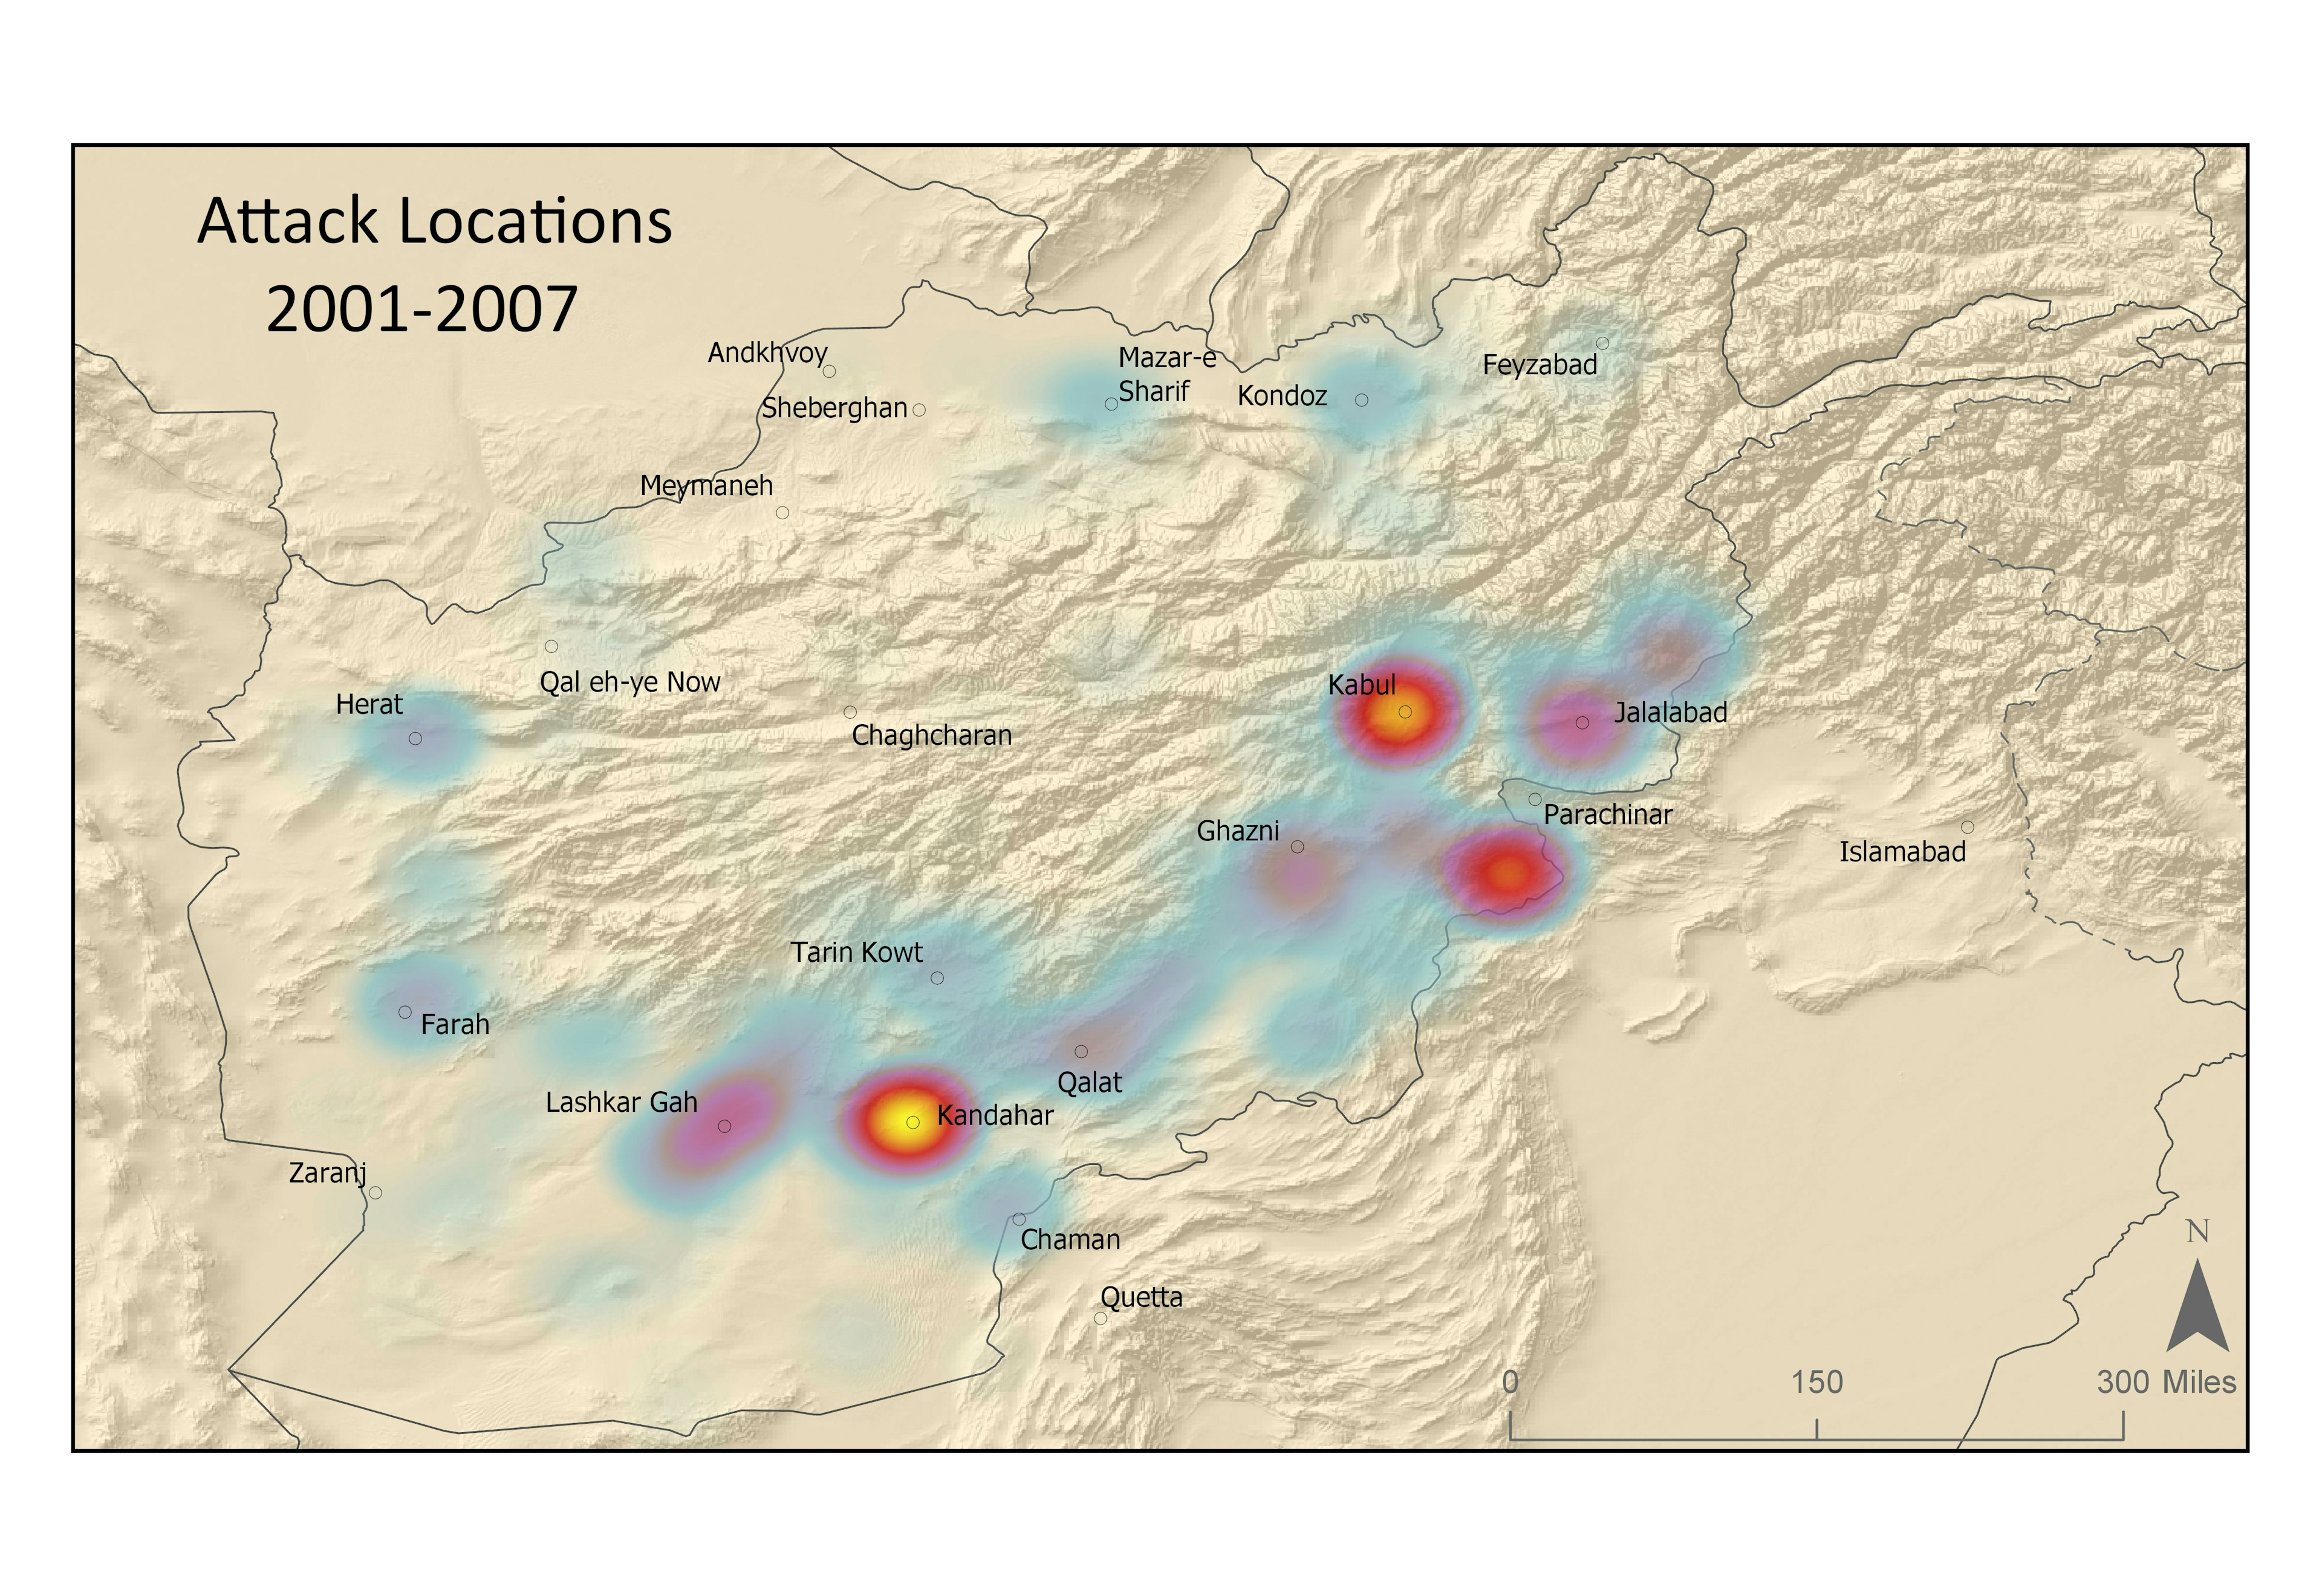
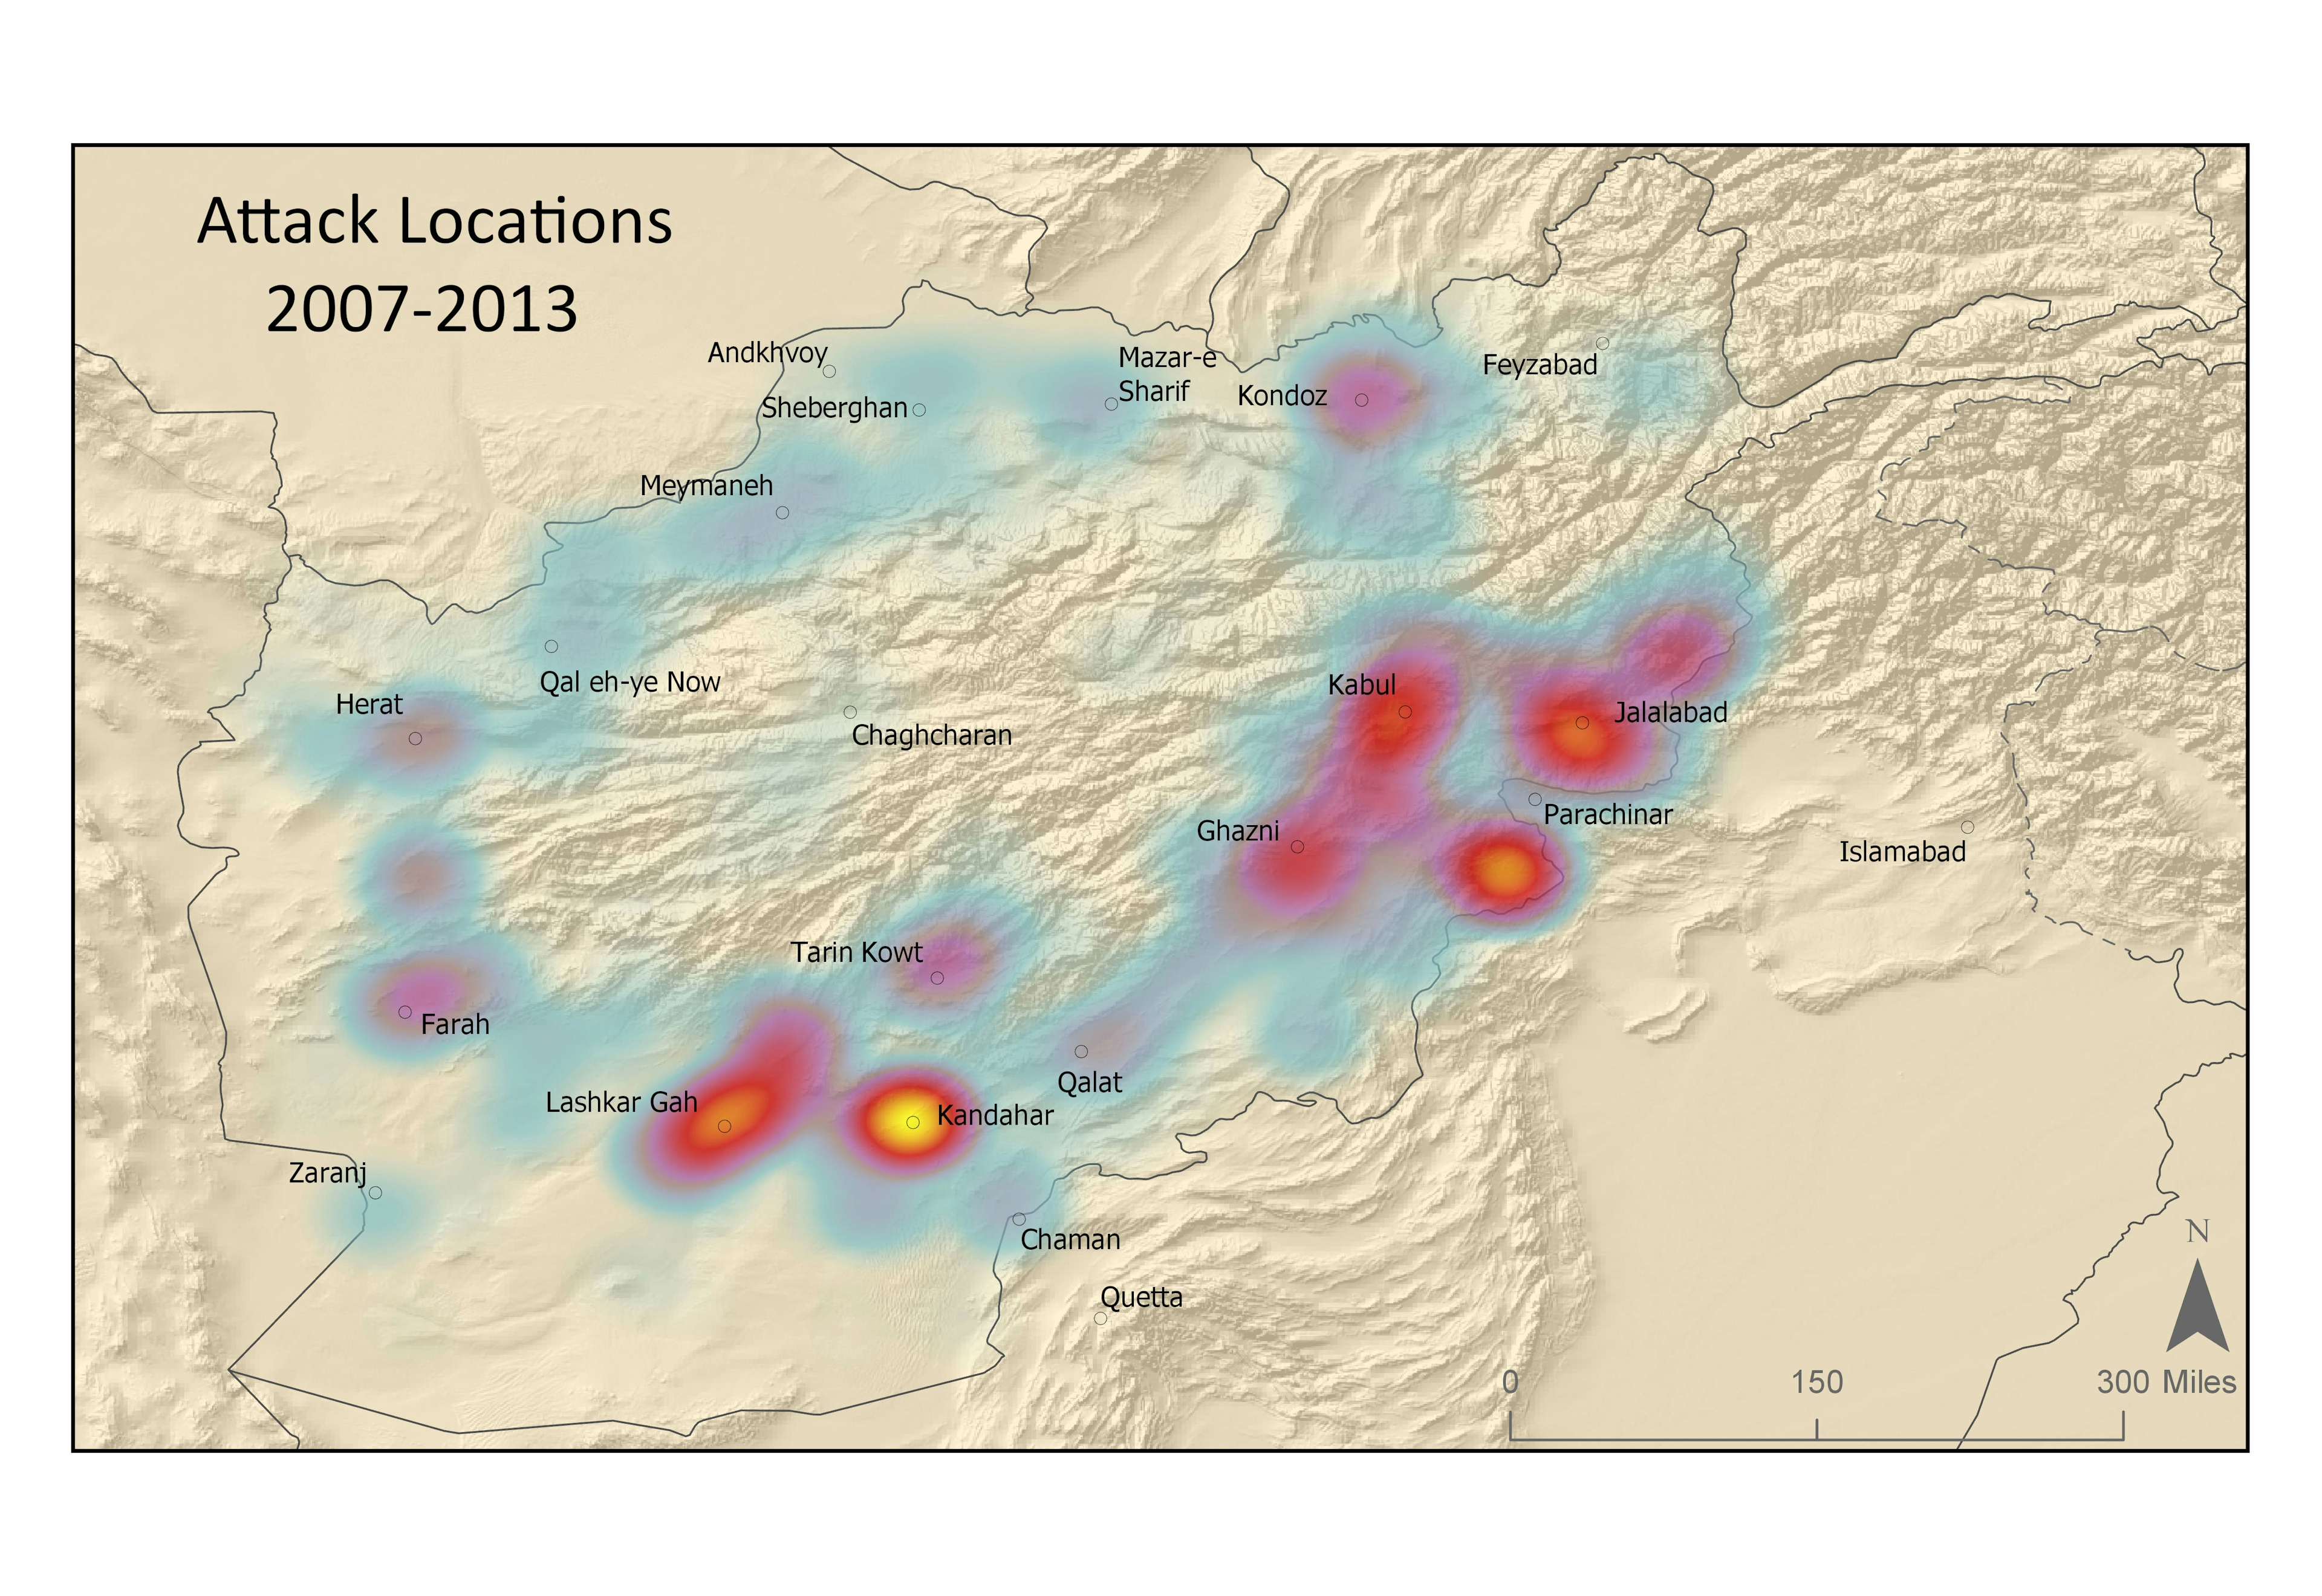
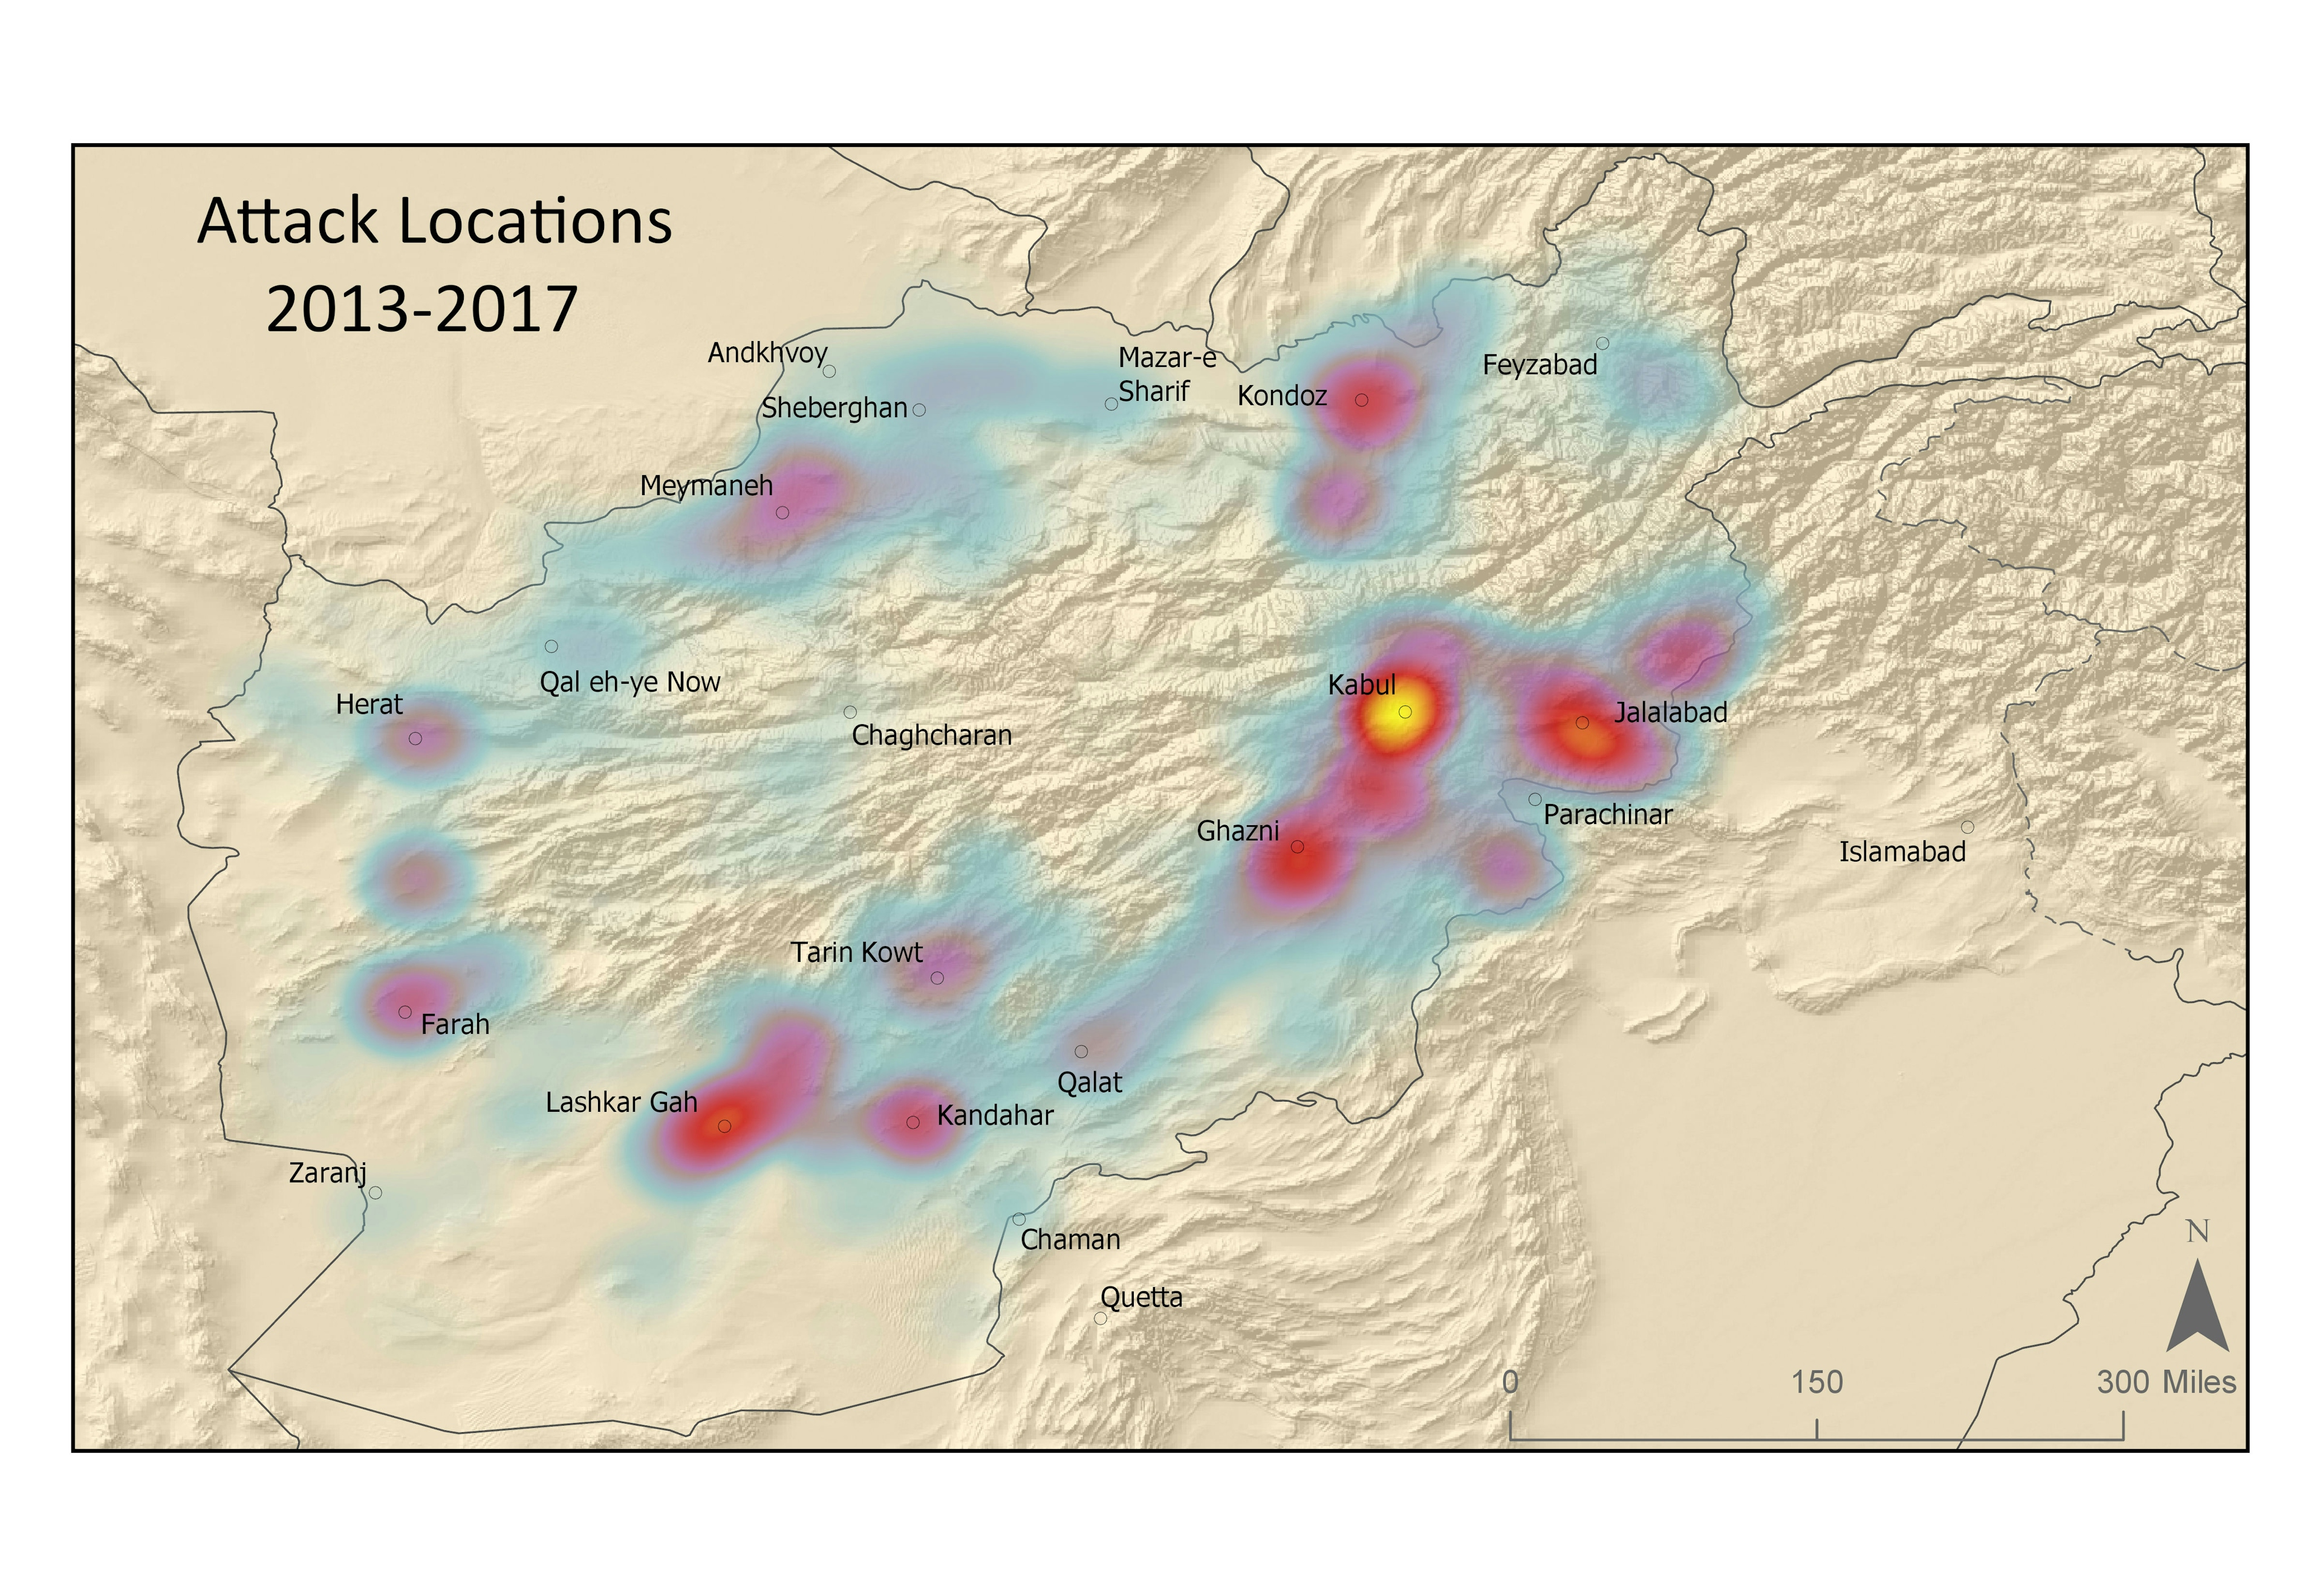
A friend studying political science was telling me about his finals paper on terror attacks in Afghanistan & Pakistan. He told me about the data and how he analyzed it. As a geographer, I couldn't help but ask if he'd included any maps! He hadn't but indicated he thought it would be great. With just a few hours left before the submission deadline I created a quick base map from a hill shade with country boundaries from Natural Earth. I converted his CSV with attack coordinated using XY Table to Points and created a set showing each attack location to show overall patterns and distributions and a set of heat maps showing how the attack hotspots shifted from year to year.
Pakistan Terror Attacks 2001 - 2007
Tools used
ArcGIS Pro
Plug-ins used
Data Management
tags
Heat MapPakistanTerrorism
More by Ryan Shields

You might also like


Join the community!
We're a place where geospatial professionals showcase their works and discover opportunities.