

It’s built on top of the Google Earth Engine (GEE) platform and provides a simple and easy-to-use interface for visualizing and analyzing geospatial data.
Installation:
!pip install geemapWith Geemap, you can create interactive maps and apps, perform spatial analysis, and work with a wide range of geospatial data sources. It also allows you to access and use the vast collection of geospatial data available on the GEE platform, which includes satellite imagery, weather data, and other environmental data.
One of the key features of Geemap is its integration with Jupyter notebooks, which makes it easy to create and share interactive maps and analyses. It also provides a wide range of mapping tools and widgets, such as the ability to draw shapes, measure distances, and export maps as images or HTML files.
In summary, Geemap is a powerful and user-friendly tool for interactive mapping and geospatial analysis in Python, and it’s especially useful for working with the Google Earth Engine platform.
Some of the applications built on top utilising Geemap:
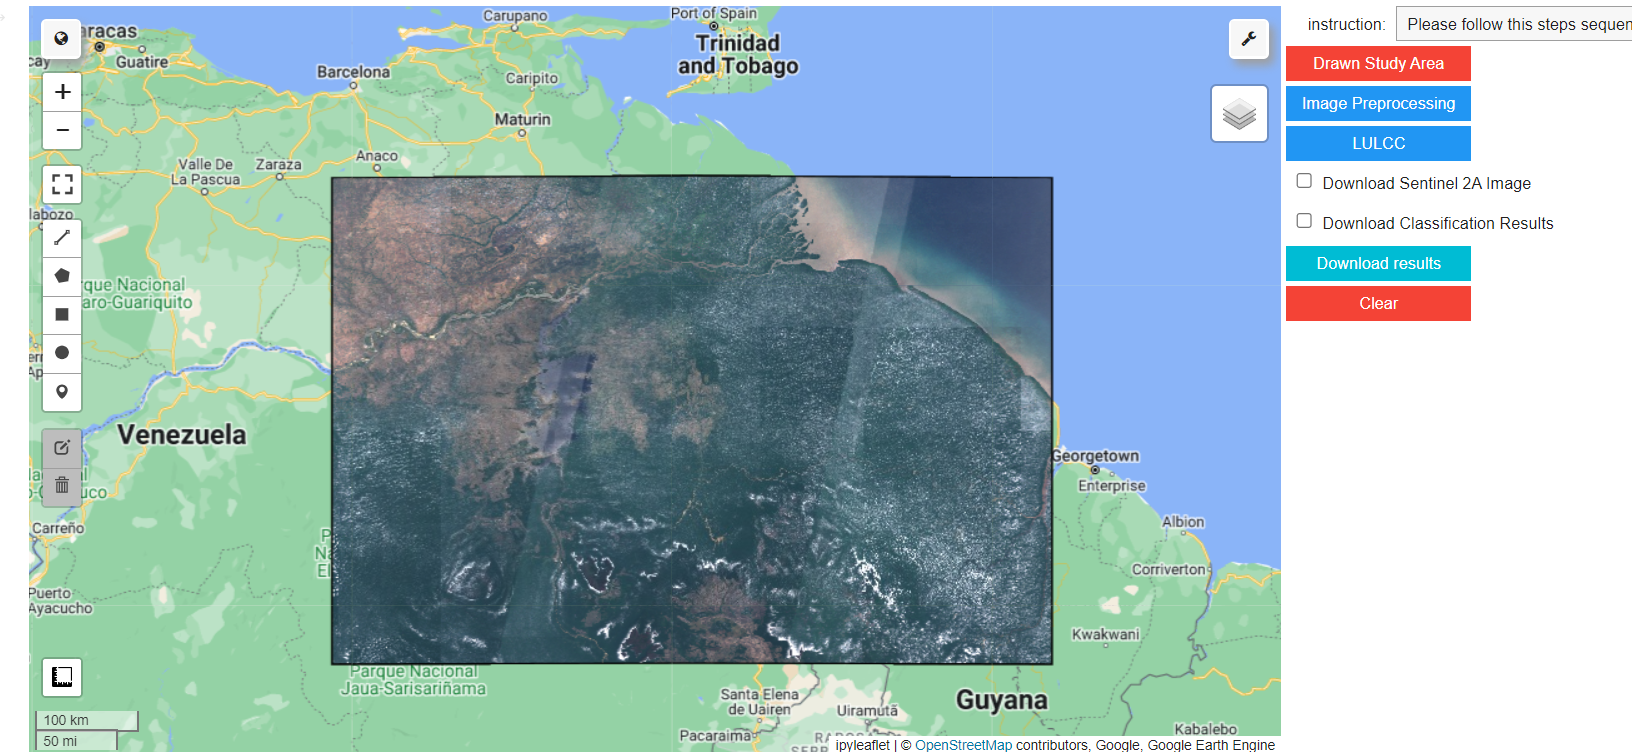
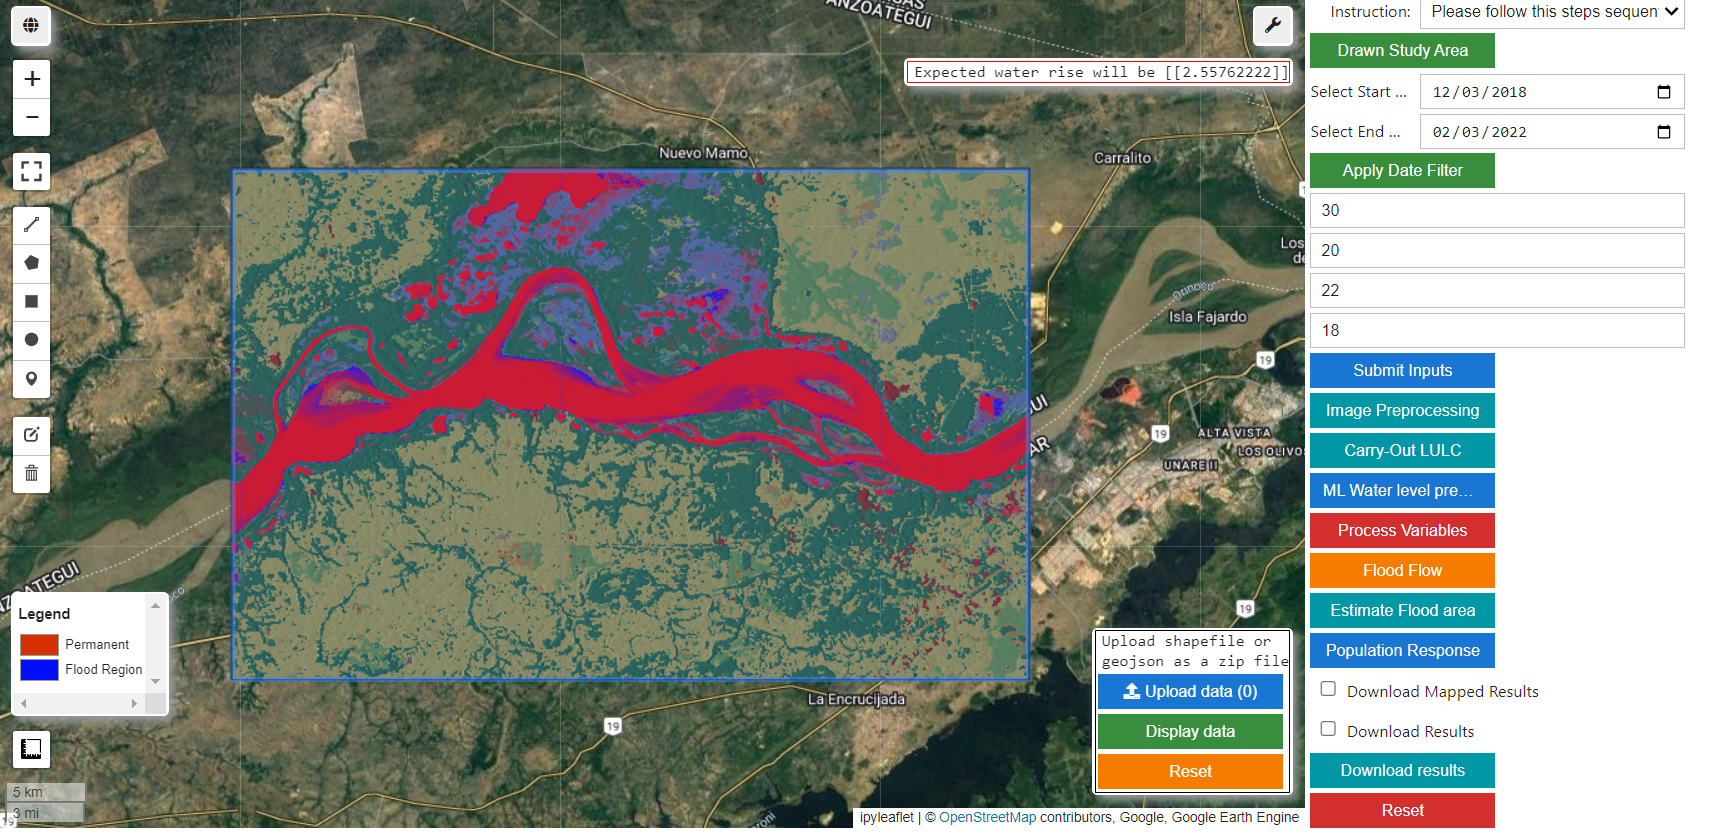
Folium: is a Python library that is used for creating interactive maps and visualizations. It is built on top of the JavaScript library Leaflet.js, which is widely used for creating interactive web maps. Folium provides an easy-to-use interface for creating custom maps with Python code, and allows you to embed maps in Jupyter notebooks, web applications, and other Python projects.
Folium
Folium supports a wide range of map tiles, including OpenStreetMap, Mapbox, and Stamen, and allows you to customize the look and feel of your maps with various markers, icons, popups, and tooltips. You can also add various layers to your maps, including GeoJSON data, markers, and heatmaps.
Installation:
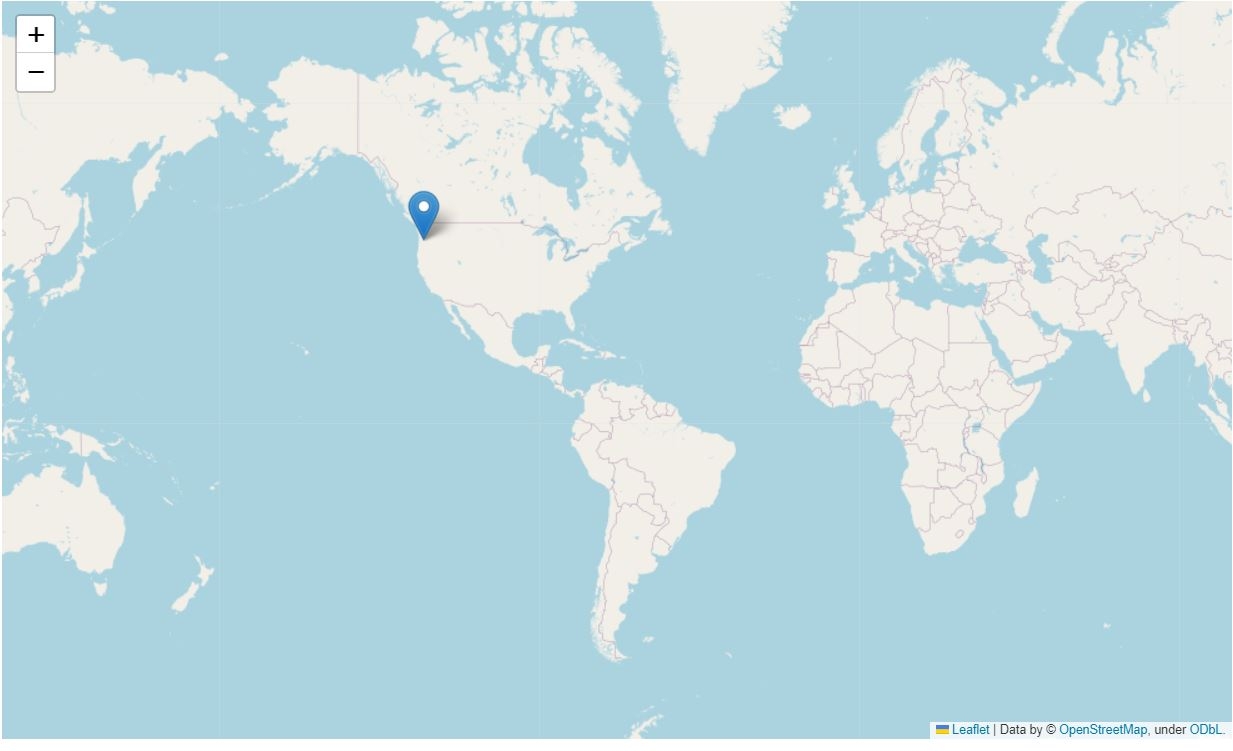
!pip install foliumOne of the key advantages of using Folium is its ease of use. With just a few lines of code, you can create interactive maps that include custom markers, polygons, and popups. Here is some sample code that demonstrates how to create a simple Folium map:
import folium

# Create a map object
m = folium.Map(location=[45.5236, -122.6750], zoom_start=13)

# Add a marker to the map
folium.Marker(location=[45.5236, -122.6750], popup='Portland').add_to(m)

# Display the map
m
Mapbox: is a powerful mapping platform that provides developers with a wide range of tools for creating custom maps and location-based applications. Mapbox offers a variety of APIs, SDKs, and tools that allow you to integrate maps, geocoding, routing, and other location-based services into your web and mobile applications.
In addition to its core mapping and location services, Mapbox also provides tools for customizing the look and feel of your maps, such as custom fonts, colors, and data visualizations. Mapbox also offers data management and analysis tools, such as the ability to upload and analyze your own geospatial data.
Mapbox can be used with a variety of programming languages, including Python, JavaScript, and Java. In Python, you can use the Mapbox API to create custom maps and visualizations using libraries such as Folium or Plotly.
To use Mapbox in Python with Folium, for example, you can create a map object using the folium.Map() function and set the tiles parameter to a Mapbox tileset URL. For example:
import folium

# Create a map object with Mapbox tiles
m = folium.Map(location=[45.5236, -122.6750], zoom_start=13, tiles='https://api.mapbox.com/styles/v1/mapbox/streets-v11/tiles/{z}/{x}/{y}?access_token=YOUR_MAPBOX_ACCESS_TOKEN')

# Add a marker to the map
folium.Marker(location=[45.5236, -122.6750], popup='Portland').add_to(m)

# Display the map
mCartopy: a library that provides a simple interface for accessing and manipulating geospatial data. With Cartopy, you can create maps and plots of geospatial data, and you have access to a wide range of data sources, including shapefiles, raster data, and web map services.
Bokeh: a library for creating interactive visualizations and dashboards in Python. With Bokeh, you can create interactive maps with pan and zoom functionality, hover tooltips, and other features, and you can embed your maps in HTML files or serve them as web applications.
Hope you have learnt something on python mapping libaries in Geospatial Visualization!
My profiles:
Fiverr: https://www.fiverr.com/s2/fef0ee42cd
Github: https://github.com/KimutaiLawrence
YOUTUBE Channel : https://www.youtube.com/@geospatialprimetech997
Twitter: https://twitter.com/lawrence_kim_?t=IgTw9ewUp1oQoKdcEirS5Q&s=09
Whatsapp Contact: +254759629059
Email: geospatialprime@gmail.com