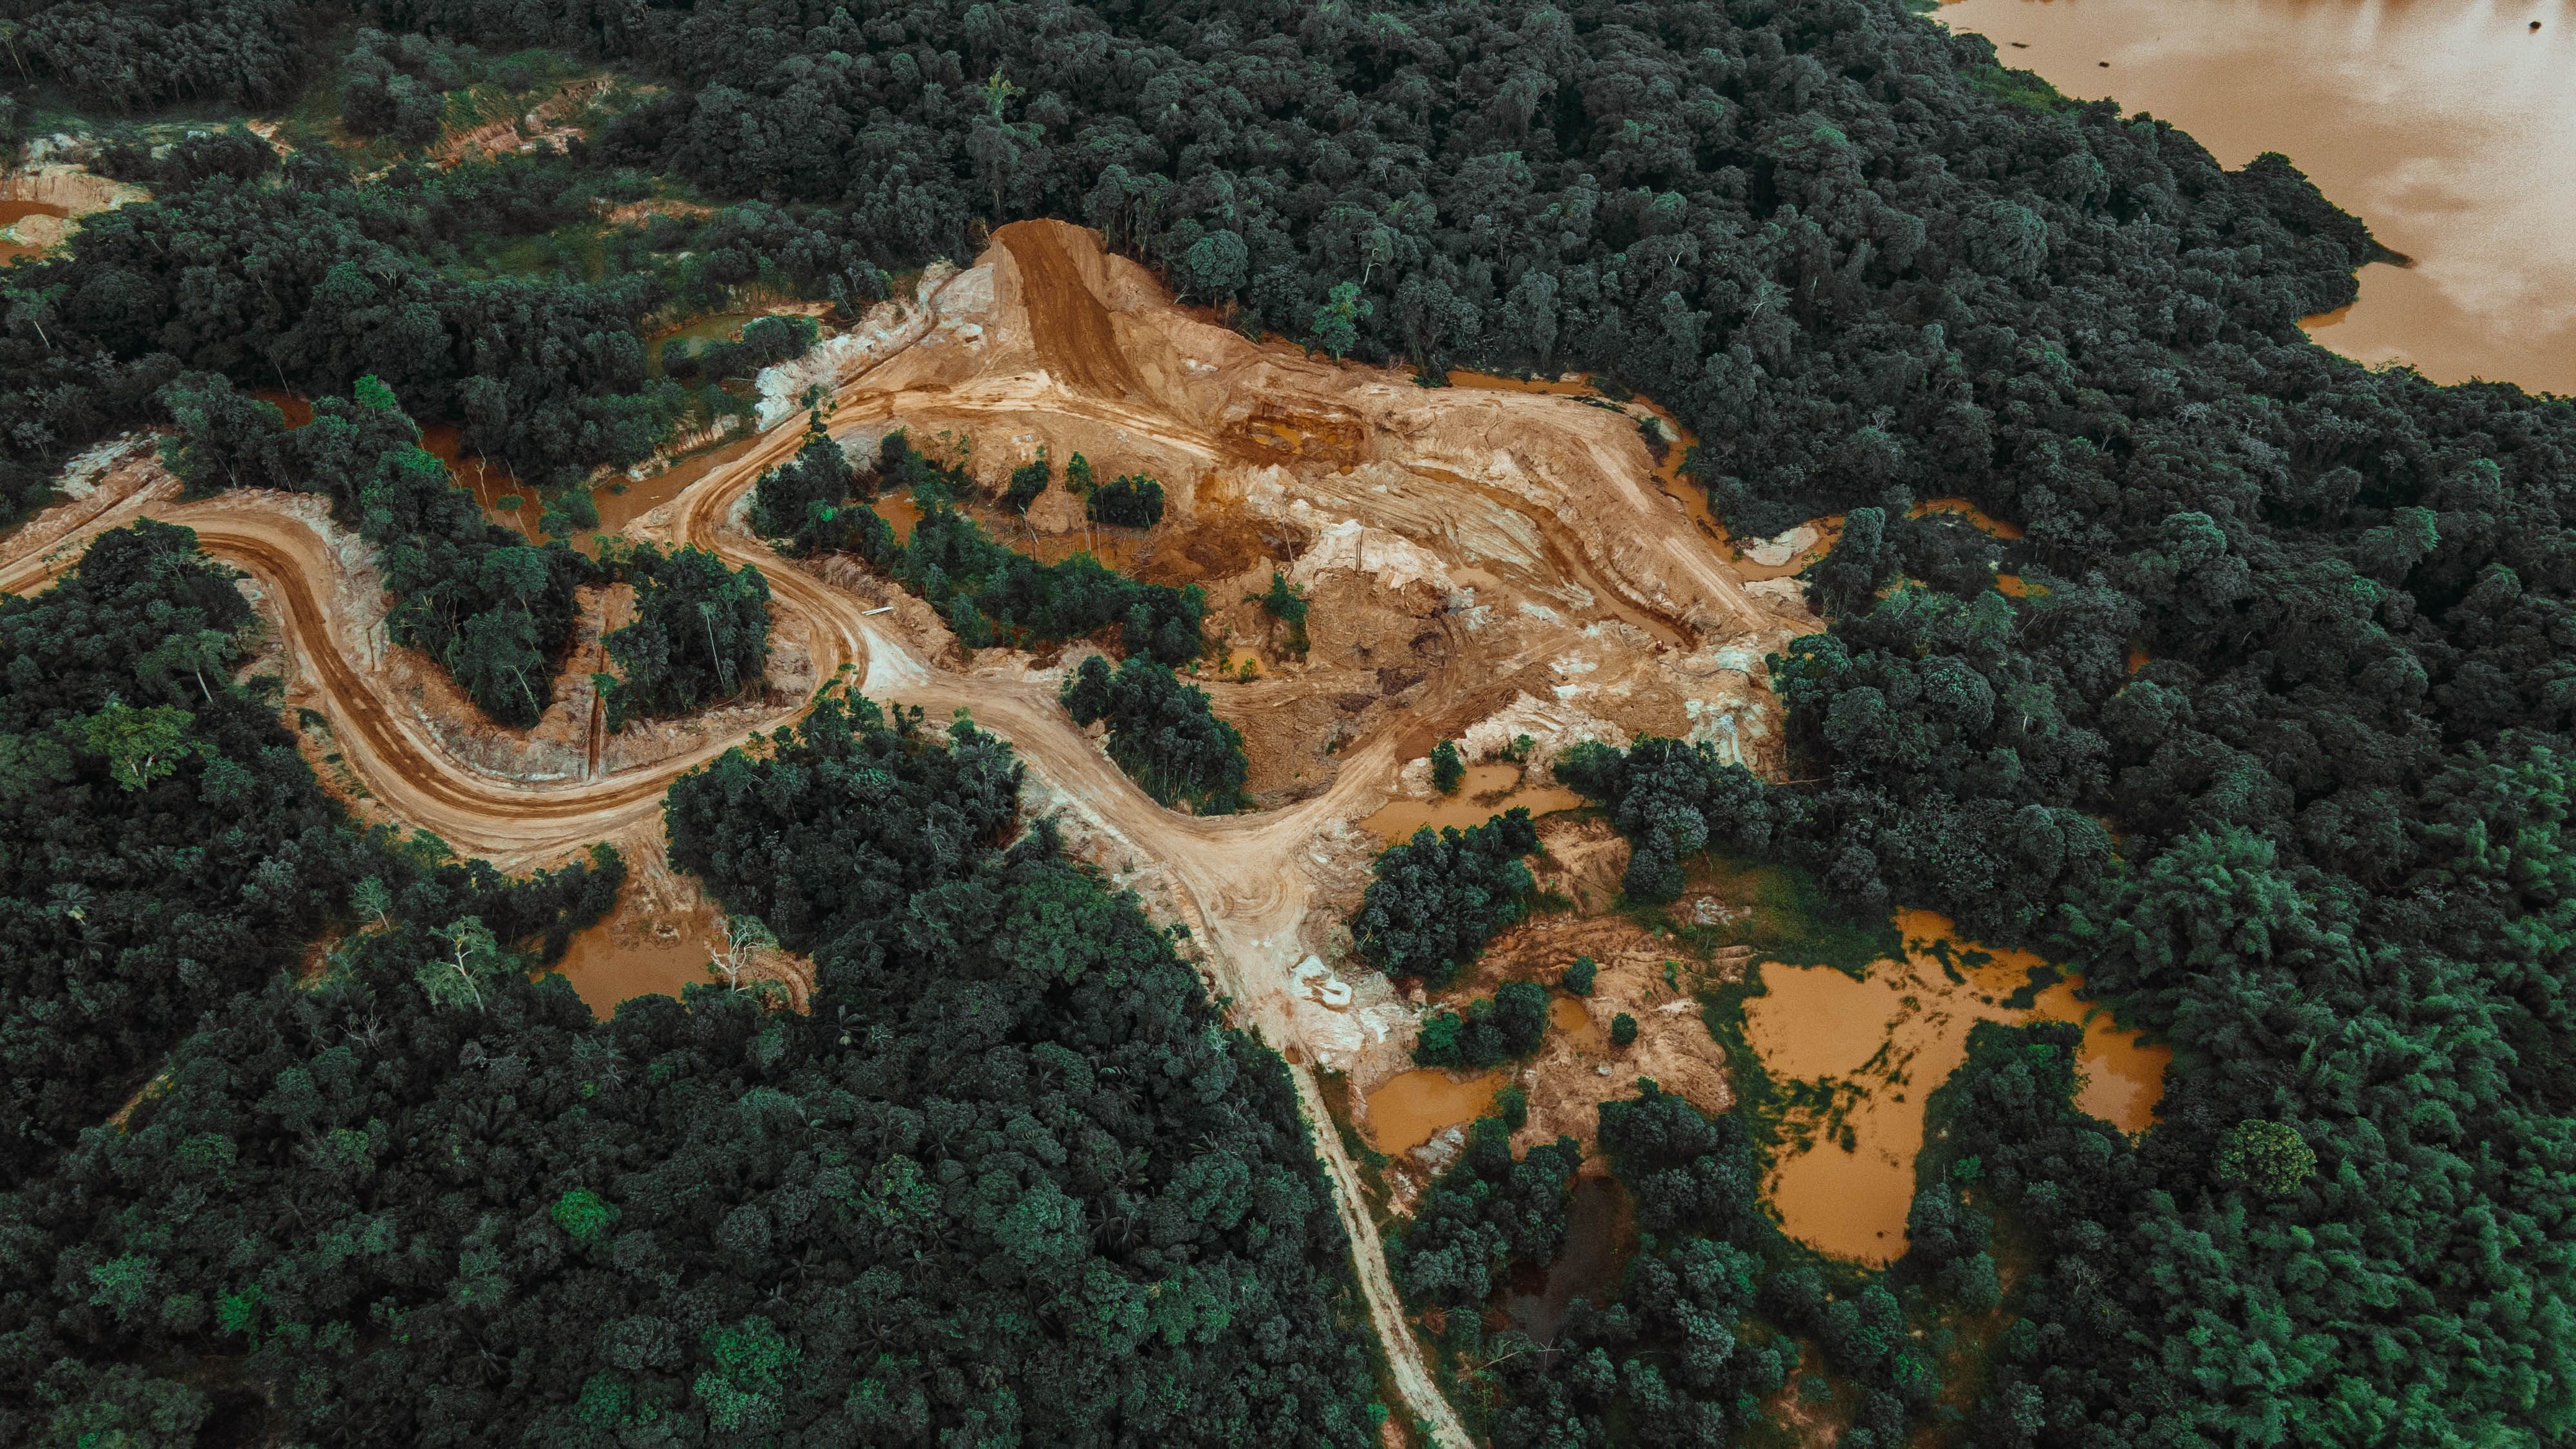
In this article, we will use Google Earth Engine (GEE) to see the phenomenon of deforestation that is occurring. We use the Hansen, et al Global Forest Change dataset (2000–2022) with the study area of West Kalimantan Province. This dataset refers to research results of Hansen, Potapov, Moore, Hancher et al. (2013) which is the result of time series analysis of Landsat images in characterizing the extent and changes of global forests from 2000 to 2022. To develop this mapping, 654.178 Landsat images were analyzed, which were re-sampled, corrected radiometrically and filtered (the presence of clouds) to produce different time series metrics, which serve to classify images with a decision tree algorithm. (Perilla & Mas, 2020). You can see the analysis framework that will be carried out in the chart below.
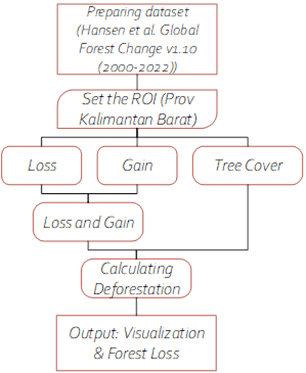
Prepare the dataset that will be used: Hansen, et al Global Forest Change (2000–2022), then define it as img.
In this article we take the study area of West Kalimantan Province. You can access the assets used at the link here. Then we define it as borneo.
First of all, let’s set the ROI. Because the assets that we imported previously were all provinces on the island of Kalimantan. So, we need to filter it first.
// Set ROI
var ROI = borneo.filter("provinsi == 'KALIMANTAN BARAT'")
Map.centerObject(ROI, 7)
As previously mentioned, the bands available in this dataset are the result of time series analysis of Landsat imagery in characterizing the extent and changes of global forests from 2000 to 2022. Therefore, we will call the bands: treecover,loss, and gain to see the forest area in year 2000 as base, forest loss area between the range year 2000 to 2022 and forest gain area. Then, clip it with the ROI that we have defined before to focusing it just in the study area.
// Define the images
var image = img.select(["lossyear"]).clip(ROI)
var lossImage = img.select(['loss']).clip(ROI)
var gainImage = img.select(['gain']).clip(ROI)
var treeCover = img.select(['treecover2000']).clip(ROI)
Then, define the intersection between gain and loss using the and() method.
// Using and() method to merge gain and loss
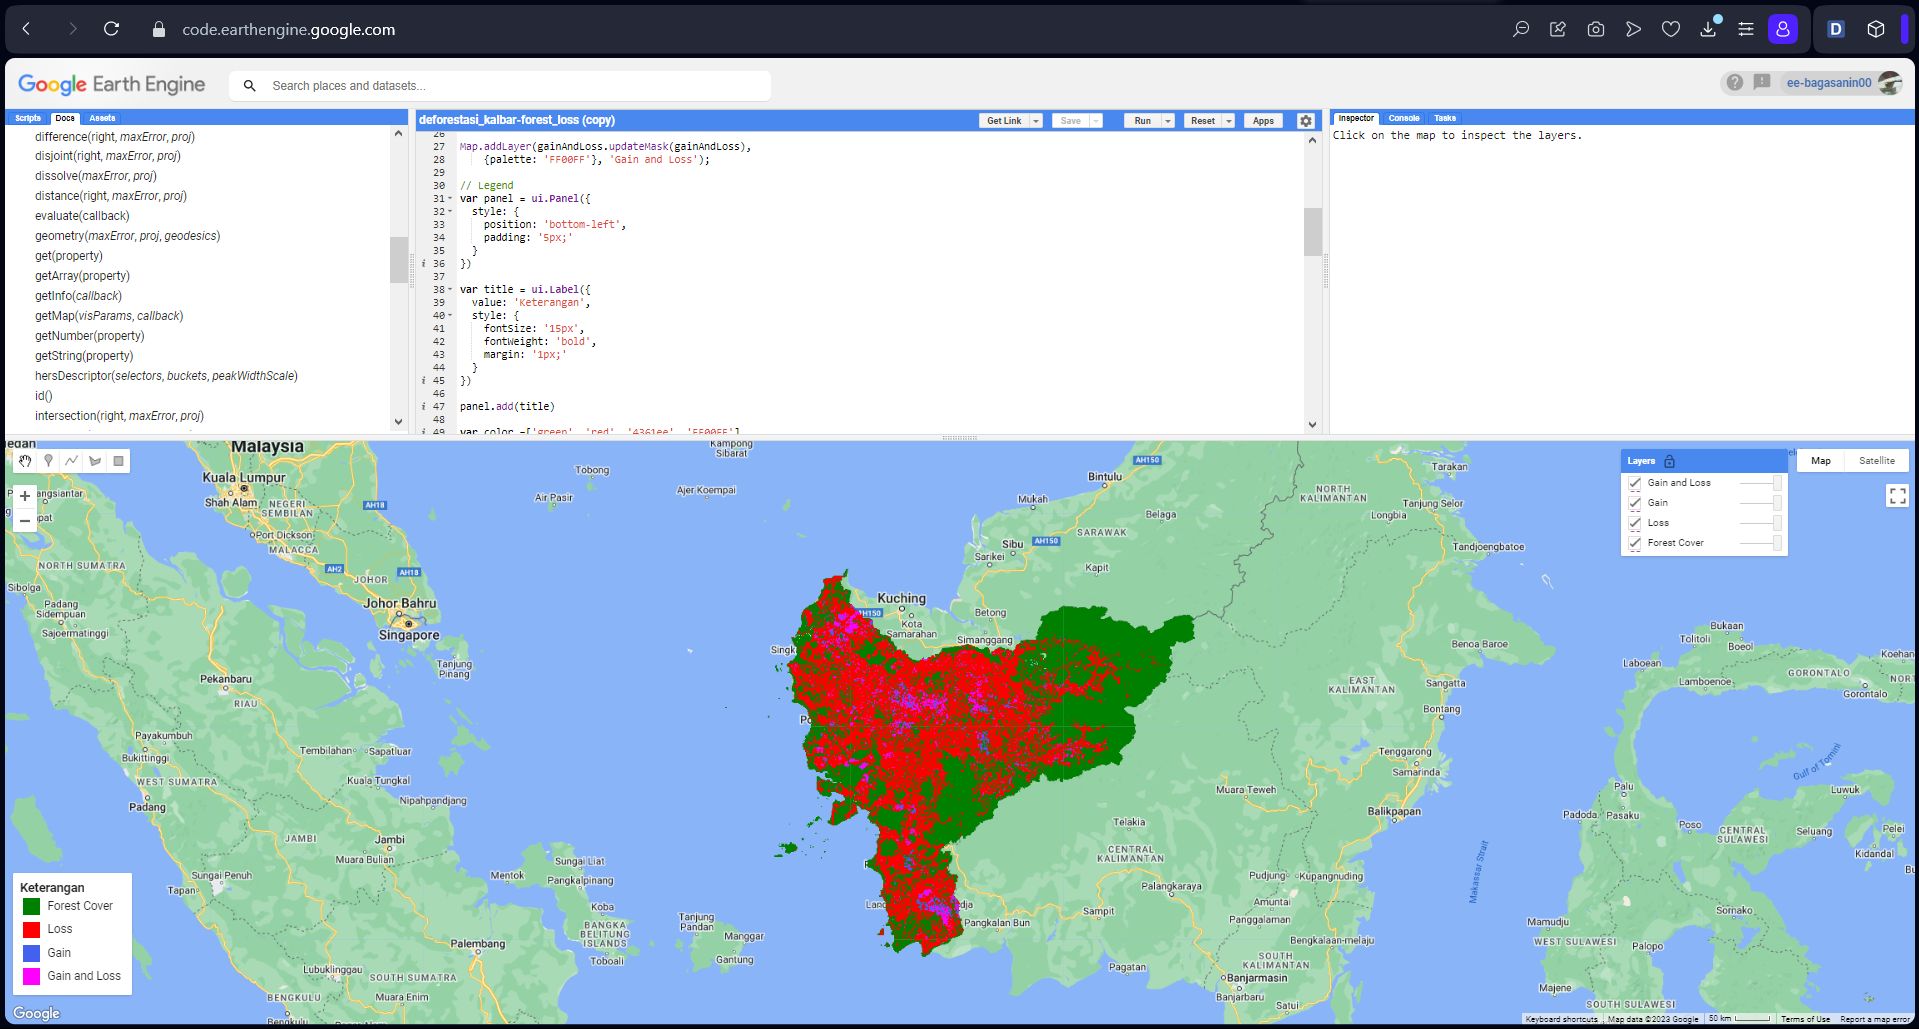
var gainAndLoss = gainImage.and(lossImage)The next step is, we will visualize the process that we have carried out previously as follows. So, you can see the layer on the top right corner (you can also toggle it to see the deforestation phenomenon).
// Vis
Map.addLayer(treeCover.updateMask(treeCover),
    {palette: ['green'], max: 100}, 'Forest Cover');

Map.addLayer(lossImage.updateMask(lossImage),
    {palette: ['FF0000']}, 'Loss');

Map.addLayer(gainImage.updateMask(gainImage),
    {palette: ['4361ee']}, 'Gain');

Map.addLayer(gainAndLoss.updateMask(gainAndLoss),
    {palette: 'FF00FF'}, 'Gain and Loss');
Then, we will try to create a legend which will be shown at the bottom left corner to make it easier for us to see the analysis results.
// Legend
var panel = ui.Panel({
  style: {
    position: 'bottom-left',
    padding: '5px;'
  }
})

var title = ui.Label({
  value: 'Keterangan',
  style: {
    fontSize: '15px',
    fontWeight: 'bold',
    margin: '1px;'
  }
})

panel.add(title)

var color =['green', 'red', '4361ee', 'FF00FF']
var classification = ['Forest Cover','Loss','Gain','Gain and Loss']

var list_legend = function(color, desc) {
  var c = ui.Label({
    style: {
      backgroundColor: color,
      padding: '10px',
      margin: '4px'
    }
  })
  var ds = ui.Label({
    value: desc,
    style: {
      margin: '5px'
    }
  })
  return ui.Panel({
    widgets: [c, ds],
    layout: ui.Panel.Layout.Flow('horizontal')
  })
}

for (var i = 0; i < 4; i++) {
  panel.add(list_legend(color[i], classification[i]));
  }

Map.add(panel);
Here’s the result from what we have done previously.
In this final step, we will try to see the decreasing forest area during the period 2001–2022 with a histogram. Here’s the script (shoutout to Huacani, et al 2022)
// List throughout the year (2001 - 2022)
var years = ee.List.sequence(1,22)

var masking = years.map(function(a){
  var mask = image.eq(ee.Number(a)).selfMask()
  var h = mask.multiply(ee.Image.pixelArea())
  var cal = h.reduceRegion({
    reducer : ee.Reducer.sum(),
    geometry: ROI,
    scale : 30,
    maxPixels : 1e12
  })
  return mask.set("area", ee.Number(cal.get("lossyear")).multiply(0.0000001))
             .set("year", ee.String(ee.Number(a).add(2000).toInt()))
})
var final_col = ee.ImageCollection.fromImages(masking)
print(final_col)

var year2 = final_col.aggregate_array("year")
var area = final_col.aggregate_array("area")

var final_lists = ee.Dictionary.fromLists(year2,area)
print(final_lists)

// Chart
var chart = ui.Chart.array.values({
  array: final_lists.values(),
  axis: 0,
  xLabels: final_lists.keys()
}).setChartType('ColumnChart')
  .setOptions({
    title: 'Yearly Forest Loss',
    hAxis: {title: 'Year', format: '####'},
    vAxis: {title: 'Area (Ha)'},
    legend: { position: "none" },
    lineWidth: 1,
    pointSize: 3
  });

print(chart);
The following is a chart showing the area of forest land decreasing (forest loss area) in the period of 2001–2022 in West Kalimantan Province.
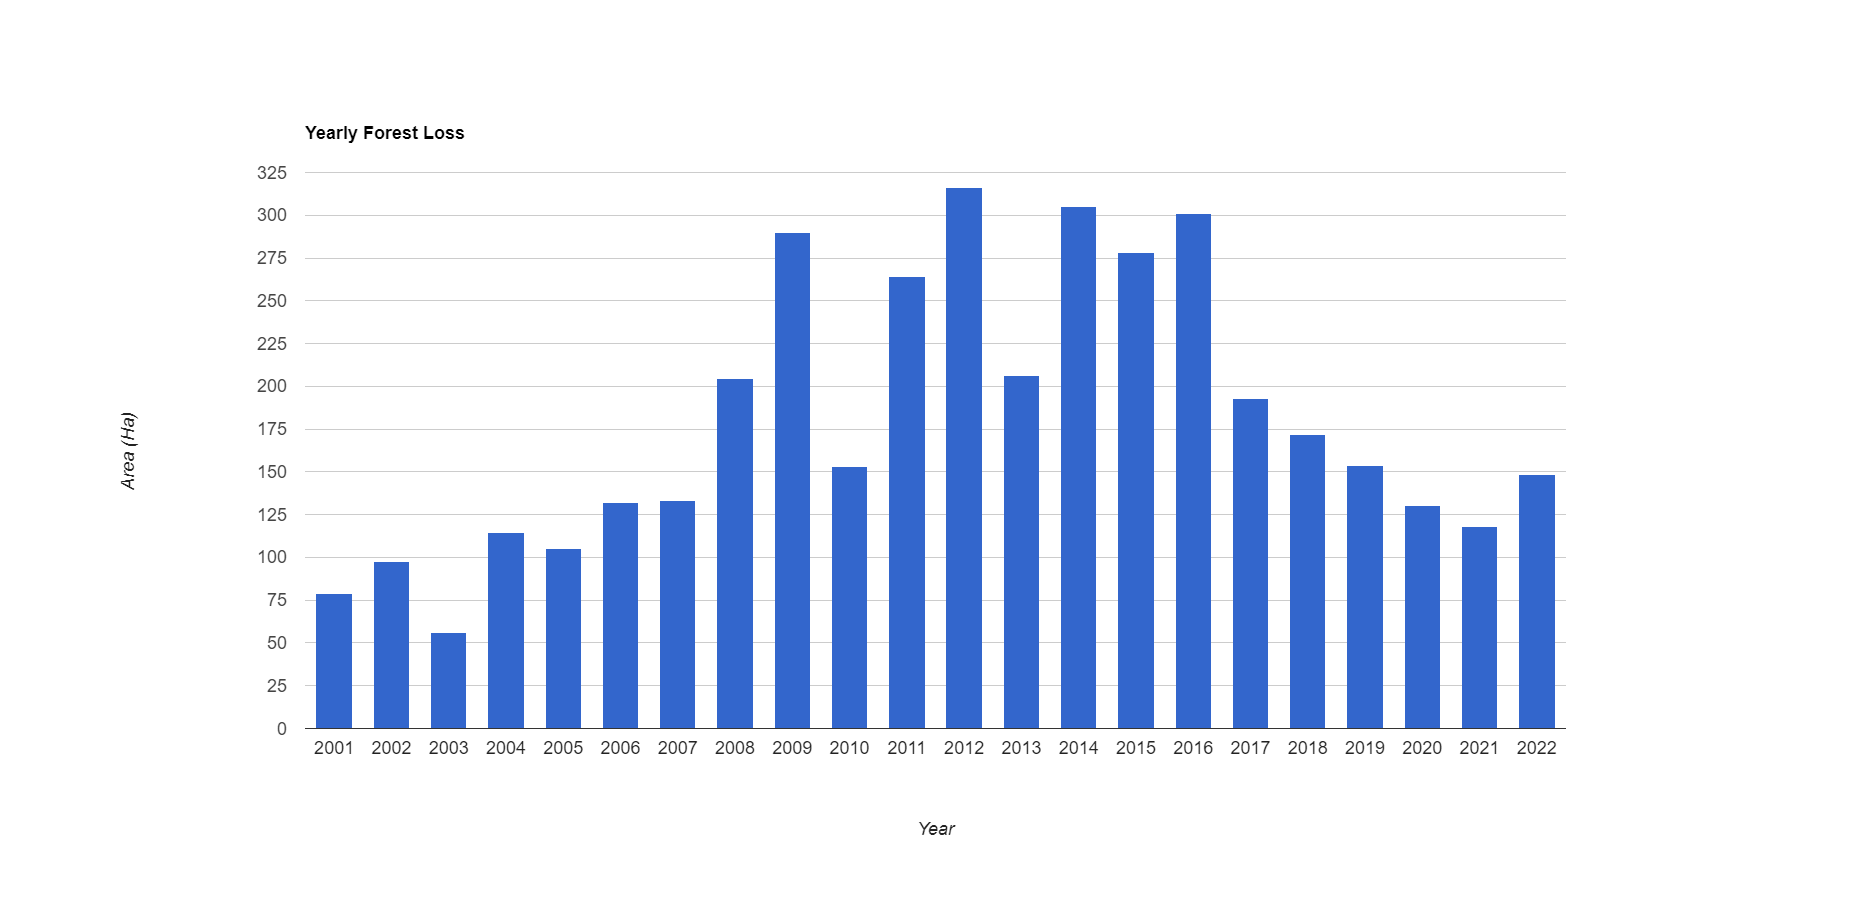
From the chart above it can be seen that in the period 2001–2022, no less than 50 ha of forest area was reduced every year. The smallest occurred in 2003 and the worst occurred in the 2009–2016 range, to be precise in 2009, 2012, 2014 and 2016. Then, the trend decreased further until 2021 and then increased slightly again in 2022. However, There are still several things that need to be considered when using this dataset, including:
Differences in Landsat sensor technology, whether Thematic Mapper, Enhanced Thematic Mapper Plus, or Operational Land Image data. For example, the Operational Land Imager (2013-onward) onboard the Landsat 8 spacecraft employs a pushbroom sensor technology that increases per observation dwell time compared to past whiskbroom systems. The result is a signal to noise ratio that is a magnitude greater than that of Landsat 7’s Enhanced Thematic Mapper Plus sensor. The increased signal enables better detection capabilities in mapping land change.
Data richness, or the number of viable land observations available as inputs to analysis. The global acquisition strategy has improved over time, with acquisitions increasing from under 150k per year in the early 2000s to over 250k per year in recent years. Additionally, Landsat 7 was the only input for the 2001–2012 initial product, and is affected by the scan-line corrector malfunction of the Enhanced Thematic Mapper from 2002 onward, where nearly a quarter of the footprint of each scene is not collected. Also, the gap between the decommissioning of Landsat 5 in 2011 and the launch of Landsat 8 in 2013 resulted in a total 2012 global collection of less than 100k Landsat 7 images.
Algorithm adjustments, including modifications of training data and input image feature space. For example, the original 2001–2012 forest loss map was made using a single algorithm run, compared to subsequent years that have been added individually. Additionally, models have been iterated to improve performance in the 2012-forward period. Such changes in the mapping method can result in year to year inconsistencies.
Therefore, for more optimal and accurate results, especially in need to policy formulation, other supporting tools and analysis are needed to complement this remote sensing-based analysis so that the resulting outcome is optimal.
You can acces the script from the link below:https://code.earthengine.google.com/f7535357e951438eb31d04bf07b02c8c
References:
Global Forest Watch: https://www.globalforestwatch.org/dashboards/country/IDN/?location=WyJjb3VudHJ5IiwiSUROIl0%3D
Mutu Institute: https://mutuinstitute.com/post/mengenal-apa-itu-deforestasi/
M. C. Hansen et al. High-Resolution Global Maps of 21st-Century Forest Cover Change.Science342,850–853(2013).DOI:10.1126/science.1244693
Perilla, G. y Mas, J. (2020). Google Earth Engine (GEE): A Powerful Tool Linking the Potential of Massive Data and the Efficiency of Cloud Processing DOI: dx.doi.org/10.14350/rig.59929.
Walquer Huacani, Nelson P. Meza, Franklin Aguirre, Darío D. Sanchez y Evelyn N. Luque (2022),” Analysis of Deforested Area Using Google Earth Engine in The Period 2001–2020 In the Apurimac Region”, Journal of Internet and e-Business Studies, Vol. 2022 (2022), Article ID 988227, DOI: 10.5171/2022.988227