To get value from spatial data, the role and importance of statistics cannot be overemphasized. All sorts of processes, including environmental, economic, and social, happen on Earth and produce patterns. Statistics help us to identify and understand these spatial processes and describe the patterns in the hope that we can understand them.

Statistics in spatial data analysis
Statistics plays a crucial role in uncovering hidden patterns and trends that influence our lives on a daily basis. From predicting the weather, computing stock prices, studying human behavior, etc., statistics is at the core of generating valuable insights from data.
Spatial analysis is a set of techniques used to analyze and understand spatial data — data that has a location component. Analysts use spatial analysis techniques to explore patterns, identify clusters and hotspots, and measure spatial relationships. It is integral to crucial decision-making in emergency management, logistics, disease mapping, urban development, etc.
Although spatial data differs from non-spatial data, spatial analysis uses computational models and statistical algorithms to translate data patterns into actionable evidence, inform decisions, and minimize risk. Thus, statistical functions in spatial analysis are the underlying framework for understanding and modeling the relationships between spatial phenomena.
“The application of statistical methods and concepts to spatial data — data that have a location component attached — and in which this locational component is used as a necessary part of the analysis is referred to as spatial statistics” — D.J Unwin.
Classical vs. Spatial Statistics Methods
Spatial data is characterized by complex patterns of heterogeneity and dependence that classical statistics methods cannot adequately describe.
Spatial heterogeneity refers to the variation in data patterns across space. Suppose you decide to climb Mount Kilimanjaro, the highest peak in Africa. As you begin your journey, you are greeted by lush rainforests filled with exotic birds and primates, with warm and humid temperatures at the base of the mountain. As you ascend higher, the temperature drops significantly due to a decrease in air pressure and increased altitude. Finally, you arrive at the summit with freezing temperatures.
The temperature variation experienced while climbing Mount Kilimanjaro illustrates spatial heterogeneity. The scenario can be further clarified by a map showing the temperature across Mount Kilimanjaro.
The characteristics of phenomena across space are not uniform and vary in intensity and quality. This variation can be due to factors including topography, climate, elevation, geology, and land use differences.

Spatial dependence refers to the relationship between neighboring observations.
Everything is related to everything else, but near things are more related than distant things — Waldo Tobler
Suppose you are driving through a city and find a certain neighborhood with high-rise apartment buildings and luxury condos with access to high-end restaurants and shops. If you were to predict residents who enjoy these luxuries, what would it be? You will assume by default that they have high-income levels or have access to wealth in some other way. If you do this, it implies you subconsciously understand spatial dependence.
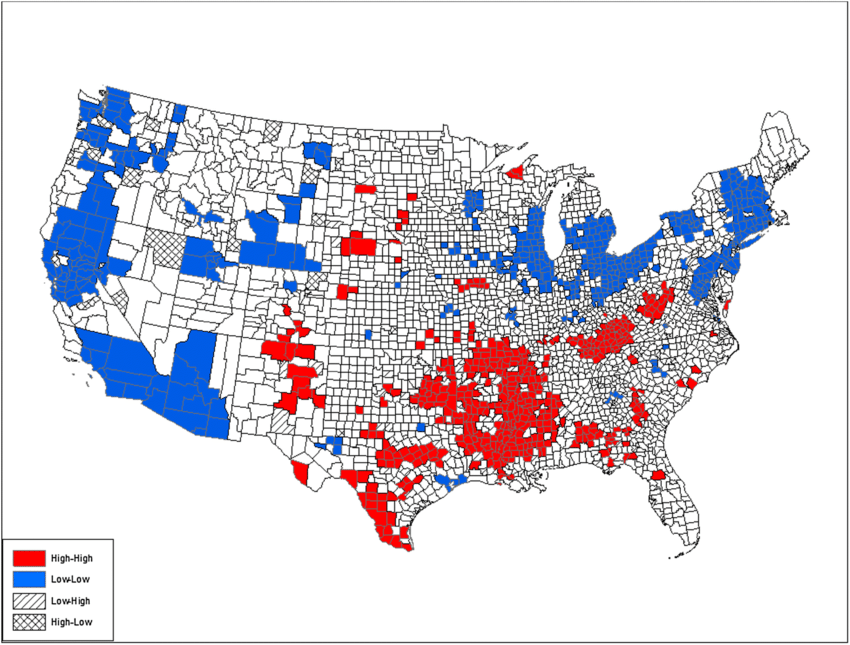
This pattern where households with similar income levels tend to cluster in certain neighborhoods due to various factors, including access to better infrastructures or proximity to the city center, is an example of spatial dependence.
This spatial pattern is usually obtained from analysis leveraging spatial statistics methods such as spatial autocorrelation, which measures the similarities between income levels in neighboring areas, or spatial regression, which models the relationship between income levels and spatially dependent predictors such as proximity to the city center.
The underlying structures of spatial data described above are fundamental to developing models and limit classical statistics methods such as mean, mode, and linear regression, where each observation is considered independent and identically distributed. Spatial statistic techniques such as spatial autocorrelation, spatial regression, geostatistics, and spatial interpolation are designed to account for them. However, a solid understanding of classical statistics provides a helpful starting point to fully understanding and applying spatial statistics concepts.
Important statistical concepts to start with
The most basic concepts in statistics, such as
The measure of central tendency (mean, mode, median) provides a way to understand the distribution of data and gives an idea of the spread of data. They can also help to identify outliers or extreme values in the dataset. Outliers usually have a significant impact on analysis and should be dealt with appropriately.
The level of measurements (Nominal, Ordinal, Interval, and Ratio) inform the selection of the statistical technique for analysis and help communicate findings effectively. Some levels of measurement are inappropriate for certain statistical tests.
Probability distribution provides a way to quantify uncertainty by describing the occurrence of an event, which can result in one of several outcomes.
Standard deviation provides a single summary measure of data distribution around its mean. It indicates how spread out the data is.
Hypothesis testing helps to draw valid conclusions. It also helps to determine if the pattern observed in a dataset is statistically significant or due to chance.
Once these general statistics concepts are mastered, proceed to learn the spatial statistics concepts.
How do statistics make you a better geospatial analyst?
Statistics helps in achieving a deeper understanding of data, making it easier to uncover patterns and trends that would otherwise be difficult to identify.
Communicating the results of spatial analysis effectively to stakeholders becomes a walk in the park.
Proficiency in statistics offers a valuable skillset and enhances competitiveness in the job market.
Learning resources to get started
Here are a few top-rated resources to get you started if you are interested in learning statistics:
Free Online Courses
Books
Naked Statistics by Charles Wheelan
How to lie with statistics by Darrel Huff
Youtube Tutorials
If you want to master something, teach it, as teaching a subject topic is learning twice.
Conclusion
Statistics are everywhere. By mastering statistics, you take a bold step to understand and unlock the full potential of spatial data and drive insight that can help communicate results.
I hope you have learned something new on your journey to becoming a better analyst. I can’t wait to see you adopt what you have read and make waves with them.