In a world where the Earth’s restless energy shapes landscapes and defines the course of history, visualizing the sheer power of earthquakes becomes an awe-inspiring endeavor. Embarking on a captivating journey, I harnessed the capabilities of QGIS to craft a compelling map titled “A Decade of Earth’s Tremors: The 10 Most Powerful Earthquakes (2000–2020)”. This article invites you to join me behind the scenes as I delve into the data sources, techniques, and insights that breathed life into this remarkable visual representation.
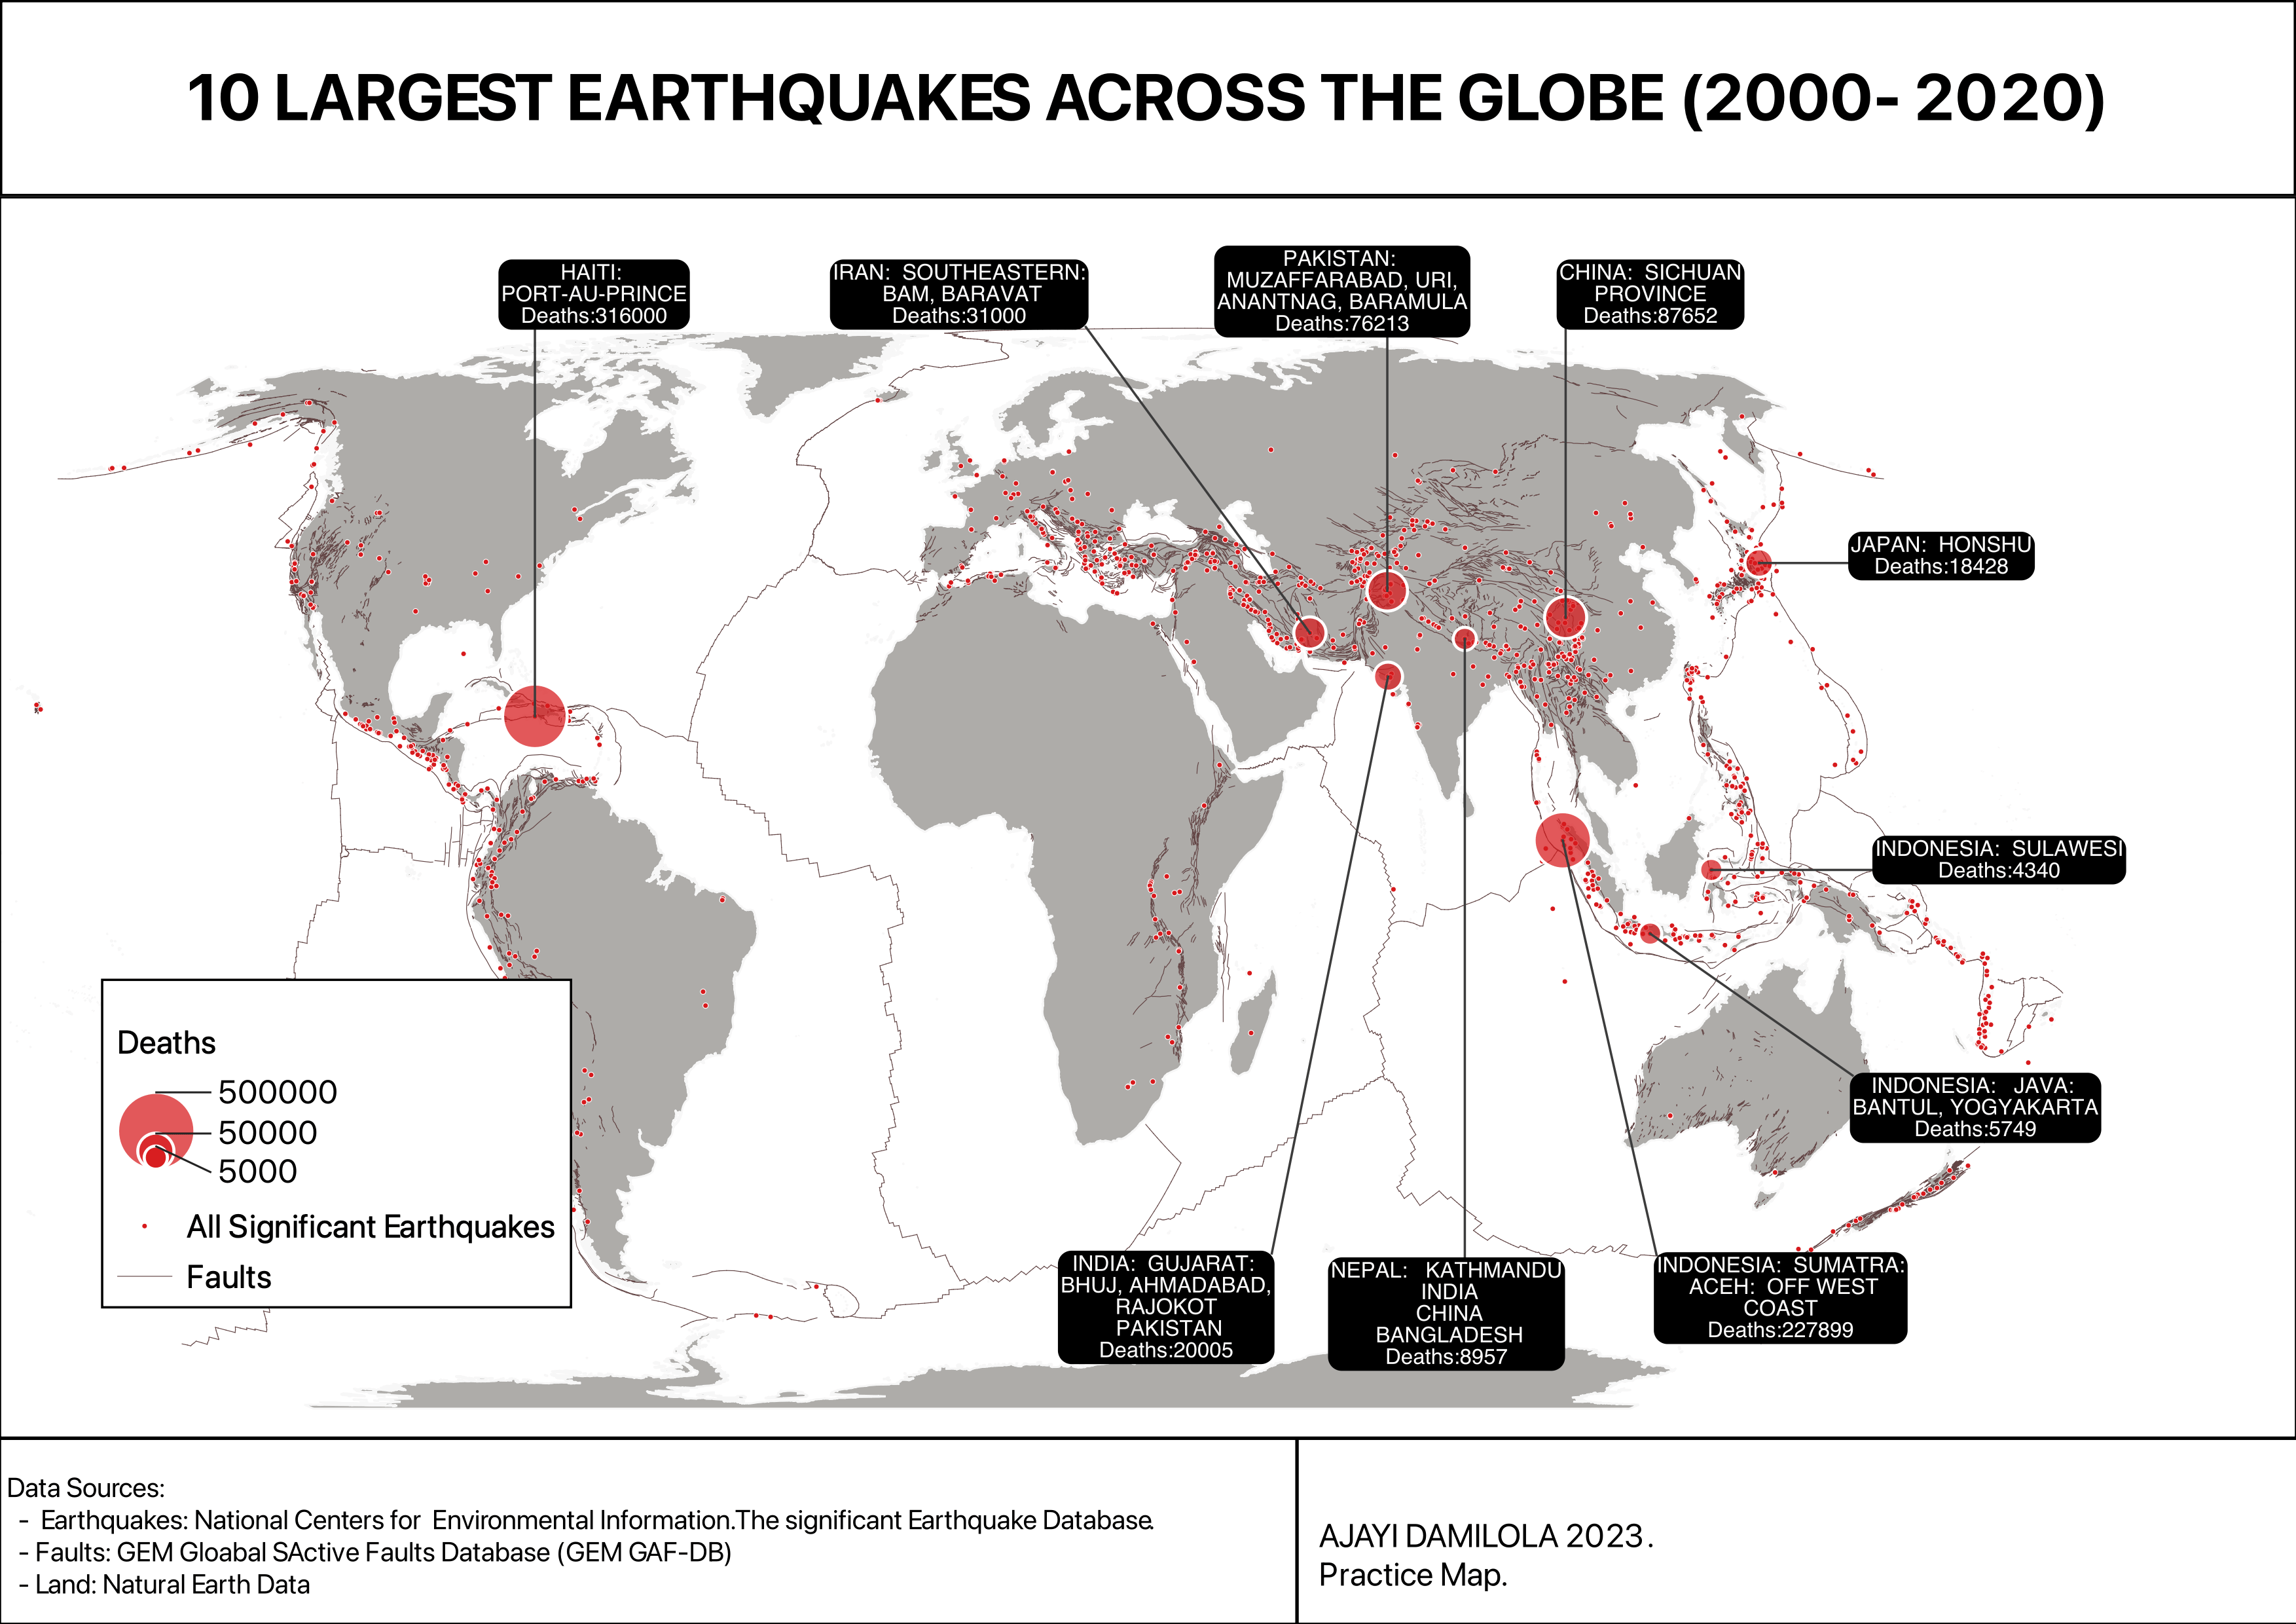
The Foundation: Data Collection and Sources Any map is only as robust as its data sources. For this project, I delved into the treasure trove of seismic information offered by the National Centers for Environmental Information’s Significant Earthquake Database. This comprehensive dataset provided a window into the seismic activity spanning two impactful decades.
To truly grasp the seismic context, I integrated data from the GEM Global Active Faults Database (GEM GAF-DB), revealing the intricate fault lines that crisscross our planet’s surface and shape its geological destiny. Adding depth to the visualization, I utilized land data from Natural Earth to frame these seismic events within the larger canvas of Earth’s diverse landscapes.
Crafting the Visual Narrative: A Symphony of Data With data in hand, the canvas of QGIS became my medium to weave a symphony of seismic narratives. Utilizing the versatile tools of QGIS, I meticulously combined, stylized, and layered earthquake data, fault lines, and land features. The result is a harmonious visual narrative that uncovers the Earth’s seismic secrets.
Epicenters of Impact: The 10 Most Powerful Earthquakes At the heart of the map lies a focal point of intrigue: the ten most powerful earthquakes that reverberated across the globe from 2000 to 2020. These seismic events, originating from regions like Haiti, Iran, Pakistan, China, Japan, Indonesia, Nepal, and more, are not just historical data points. They symbolize the Earth’s energy in its most formidable form.
Through strategic layering and meticulous positioning, I highlighted the epicenters of these earthquakes, allowing viewers to immerse themselves in the very heart of these seismic storms.
Beyond the Visual: Education and Awareness This map is more than a visual masterpiece; it is a tool for education and enlightenment. By sharing this creation with my esteemed colleagues, my aim is to initiate discussions around the importance of comprehending Earth’s geological dynamics and the potential impact of seismic events on vulnerable regions. This map is a poignant reminder that beneath our feet, forces of unparalleled magnitude shape our world in ways that demand our attention and respect.
Conclusion: Unveiling Earth’s Hidden Stories The journey to create the “A Decade of Earth’s Tremors: The 10 Most Powerful Earthquakes (2000–2020)” map has been a profound exploration of Earth’s ever-moving dance. This endeavor has deepened my understanding of our planet’s intricate rhythms while underscoring the power of technology in translating complex scientific data into captivating visual stories. As you explore this map, may it serve as a testament to the Earth’s enduring energy and the beauty of unraveling its hidden stories.
#EarthquakeMapping #GISVisualization #SeismicJourney #QGISMasterpiece #GeologicalForces