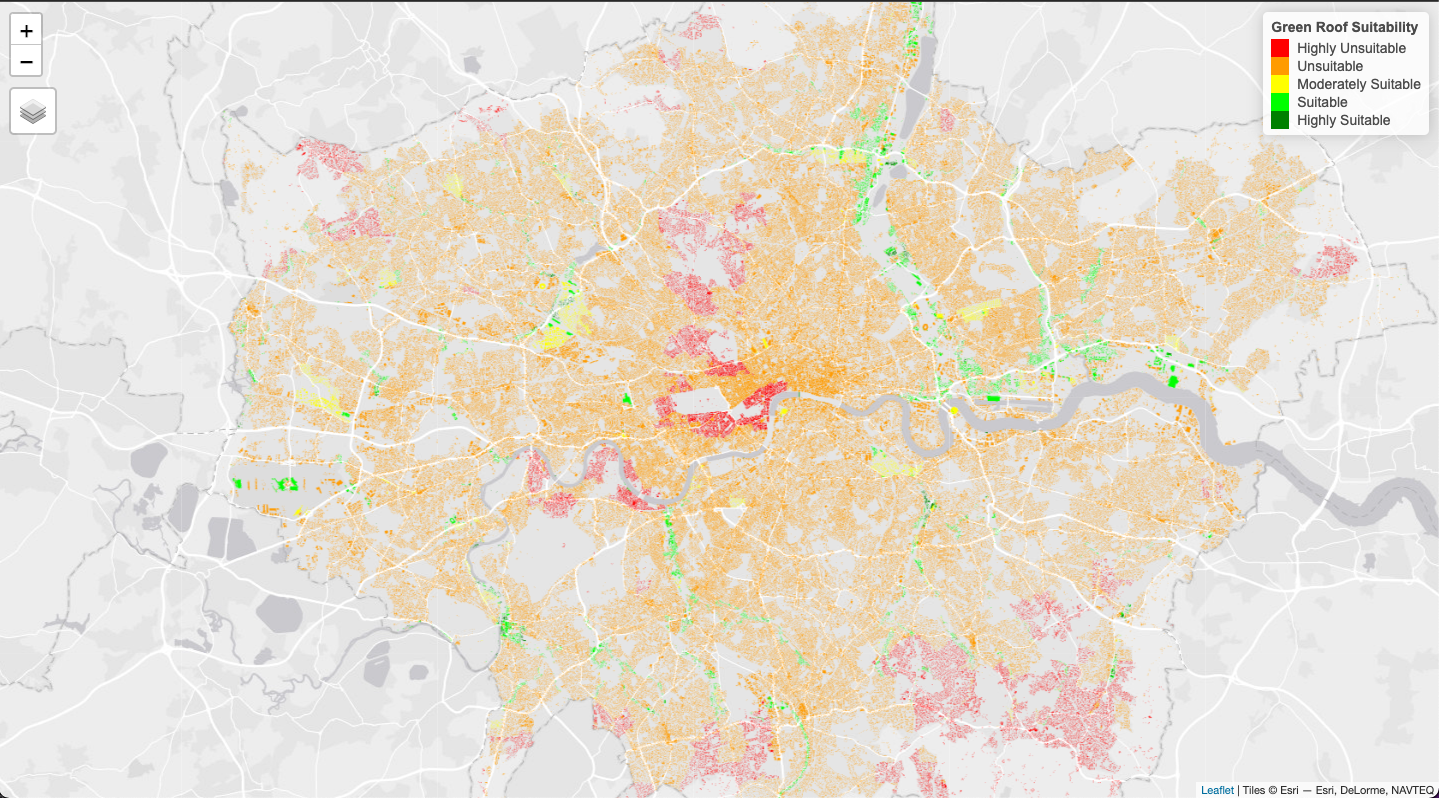
For my GIS assignment in the MSc Smart Cities Urban Analytics course, I built a multi-criteria analysis tool for identifying locations that would optimise the environmental, social and economic benefits of green roofs in London. The analysis was based on 9 criteria:
- Roof size (m^2)
- Nitrogen Dioxide Concentration
- Particulate Matter 2.5 Concentration
- Flood Risk Zones
- Urban Heat Island Data
- Life Expectancy - ward level
- Access to Green Space - ward level
- Subjective Happiness (Well-being) Score - ward level
- Median House Price - ward level
Spatial data for each criteria was collected from the London datastore (https://data.london.gov.uk/). Each layer had to be re-scaled and rasterised to allow a weighted combination for the multi-criteria analysis. Weights for each layer were closed based on subjective importance, however these can be changed based on user preference. All raster layers were trimmed with the building roof layer, as these are the only locations that a green roof can be built. The output of the analysis is a raster layer where each pixel has a suitability index from 0-1, as shown in the map above.


.svg "Maggie Zou")

 He")