Urbanization and industrialization are the world’s highest excuse of the rate of deforestation globally experienced and North Central Nigeria is not left out of this scenario. This research has shown the rate of changes in land use in North Central Nigeria between 1972 to 2018 while assessing the rate of forest depletion in the study area and results show that forest has given way to built-up areas, and grassland in most areas. This is substantiated by the analysis of land surface temperature which shows an increase in urban land surface temperature due to the reduction of area extent to forested areas and grasslands.
Generating training samples
The image was initially classified using the ISODATA algorithm to perform an unsupervised classification. The ISODATA clustering method uses the minimum spectral distance formula to form clusters. It begins with either arbitrary cluster means or the means of an existing signature set, and each time the clustering repeats, the means of these clusters are shifted. The new cluster means are used for the next iteration.
This process helps in separating the images into unique spectral classes. The ISODATA method repeats the clustering of the image until either:
(a) a maximum number of iterations has been performed, or (b) a maximum percentage of unchanged pixels has been reached between two iterations.
The image generated 36 classes through 10 iterations at 0.97convergence threshold *The convergence threshold is the maximum percentage of pixels that has cluster assignments that can go unchanged between iterations. This threshold prevents the ISODATA utility from running indefinitely.
By specifying a convergence threshold of 0.95, you are specifying that as soon as 95% or more of the pixels stay in the same cluster between one iteration and the next, the utility should stop processing. In other words, as soon as 5% or fewer of the pixels change clusters between iterations, the utility stops processing). the classes were then grouped using trained eye assessments and google earth pro. The generated classification was then converted to shapefiles and introduced into the ArcGIS image classification window as training samples.
Random Forest Supervised Classification Algorithm.
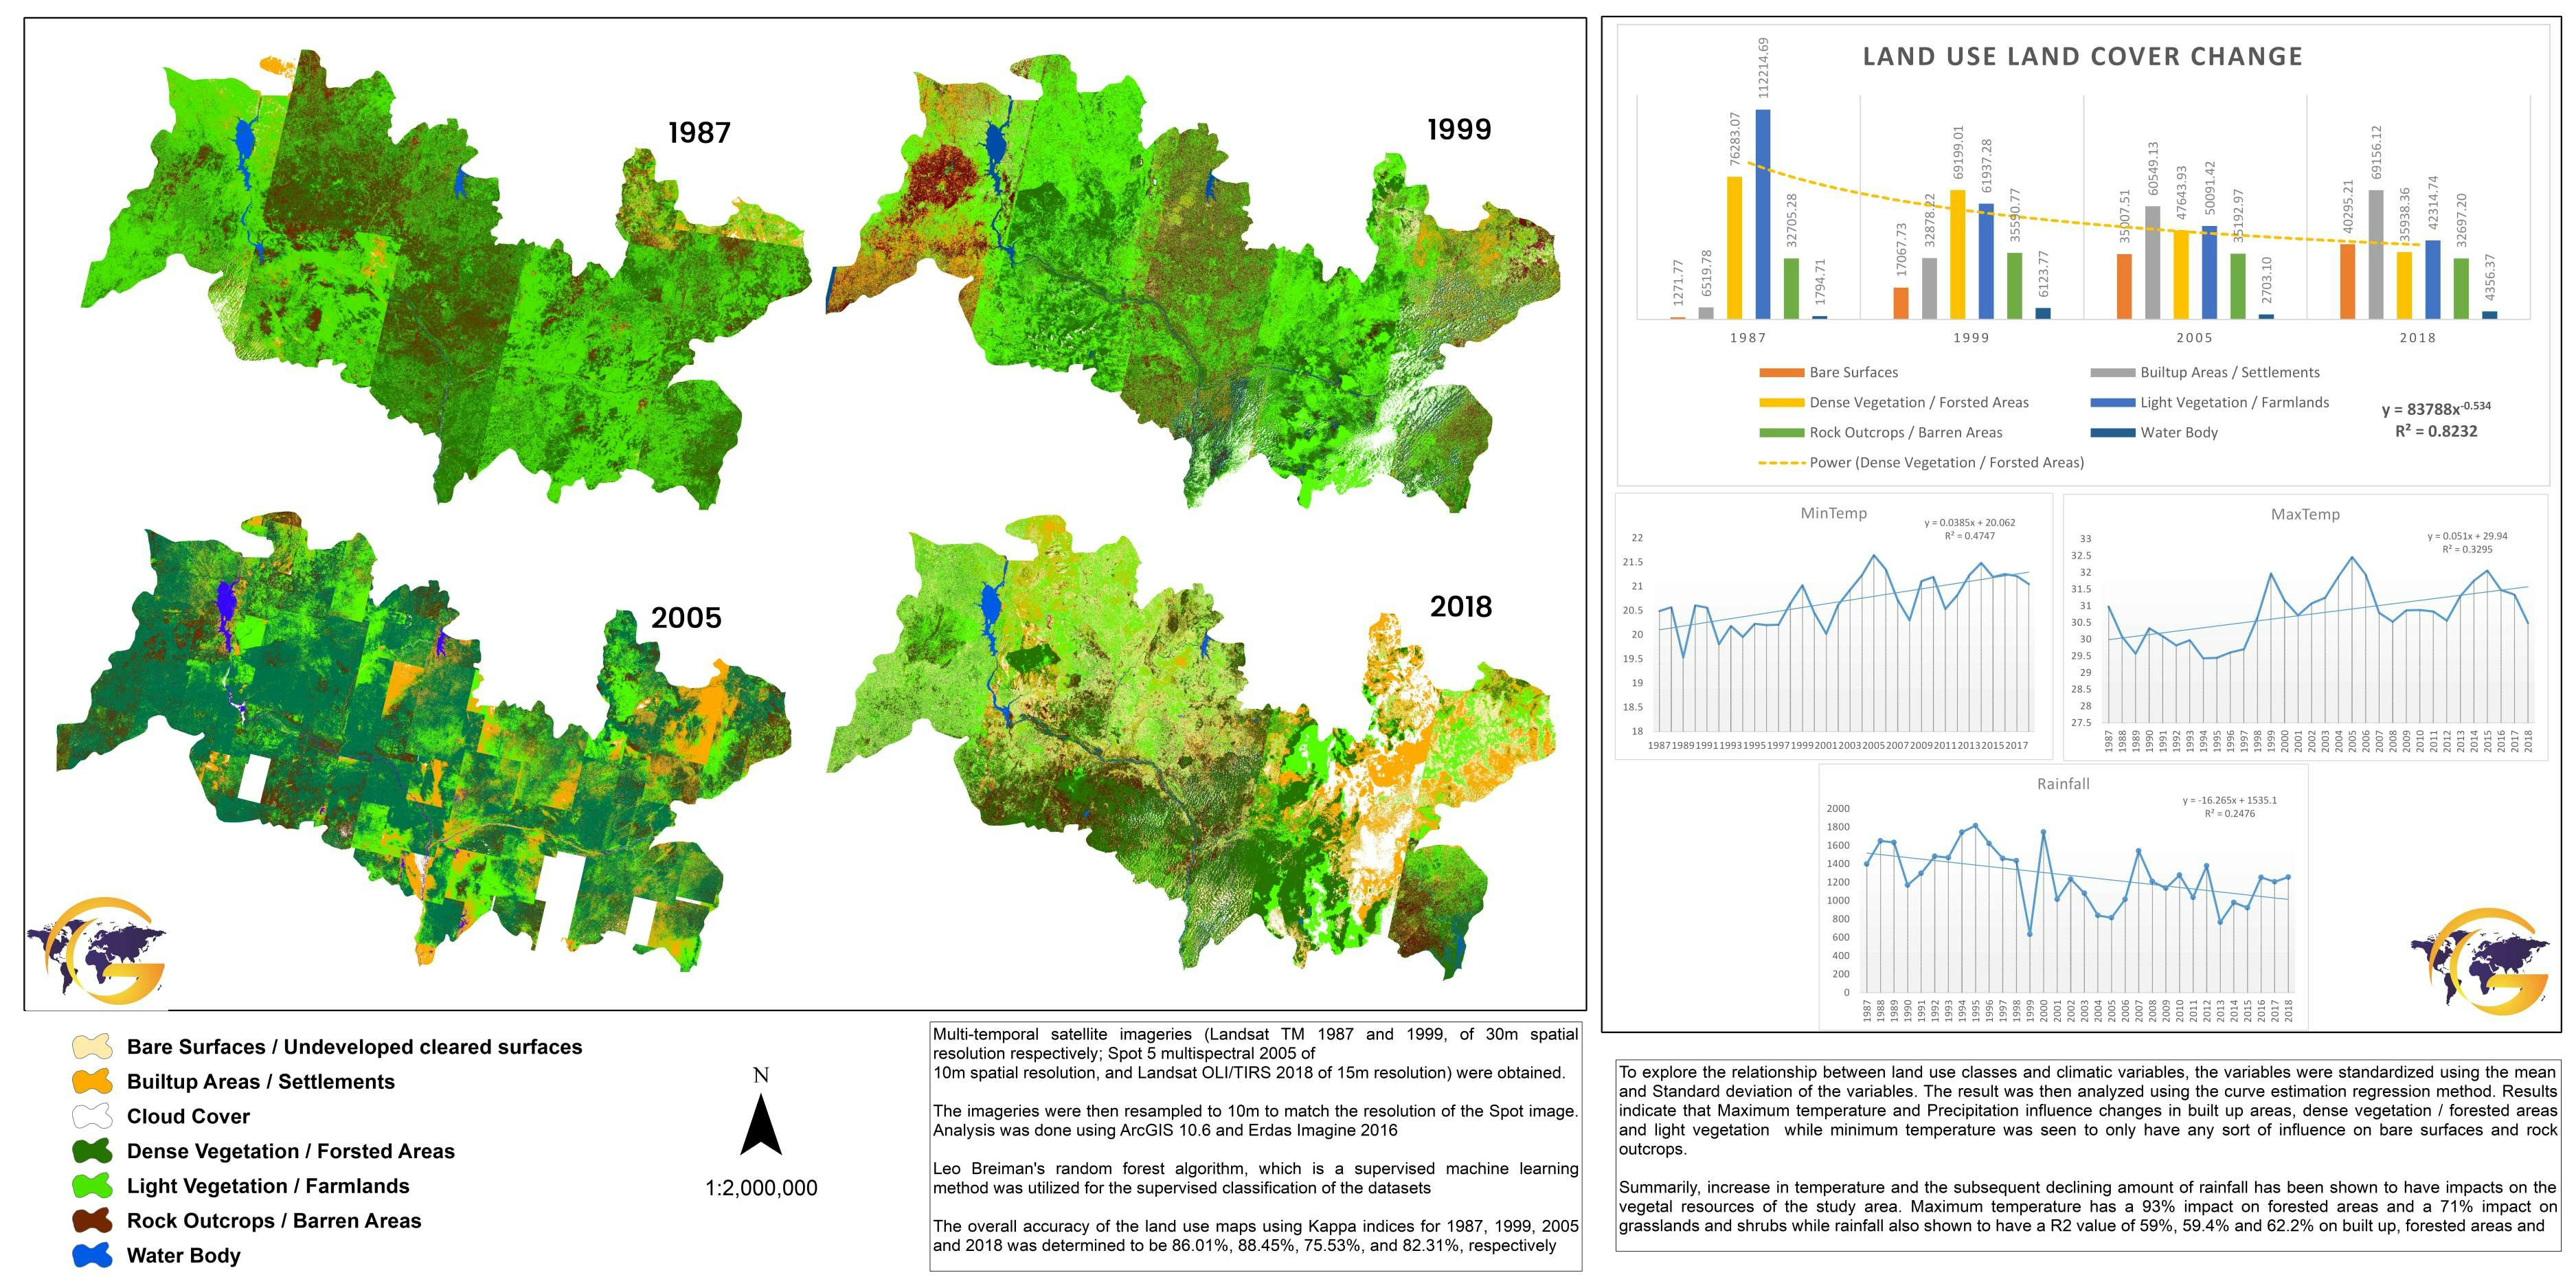
Leo Breiman's random forest algorithm, which is a supervised machine learning method was utilized for the supervised classification of the datasets. The random forest algorithm makes use of decision trees, usually many decision trees, called an ensemble or a forest, that are then used for prediction. Each tree generates its own prediction and is used as part of a voting scheme to make final predictions. The final predictions are not based on any single tree but rather on the entire forest. The use of the entire forest rather than an individual tree helps avoid overfitting the model to the training dataset, as does the use of both a random subset of the training data and a random subset of explanatory variables in each tree that comprises the forest. (ESRI, 2018). For this research, 20% of the training samples were trained by the random forest classifier. The model output was adjusted and reviewed until it suited the expected model behaviour of the datasets. The model was then applied to the image to generate a supervised classification of the study area.
Accuracy Assessment
The overall accuracy of the land use maps using Kappa indices for 1987, 1999, 2005 and 2018 was determined to be 86.01%, 88.45%, 75.53%, and 82.31%, respectively
Climate Change and Land Use Change
To explore the relationship between land use classes and climatic variables, the variables were standardized using the mean and Standard deviation of the variables. The result was then analyzed using the curve estimation regression method. Results indicate that Maximum temperature and Precipitation influence changes in built-up areas, dense vegetation / forested areas and light vegetation (Table 6) while the minimum temperature was seen to only have any sort of influence on bare surfaces and rock outcrops.
Summarily, an increase in temperature and the subsequent declining amount of rainfall has been shown to have impacts on the vegetal resources of the study area. The maximum temperature has a 93% impact on forested areas and a 71% impact on grasslands and shrubs while rainfall is also shown to have an R2 value of 59%, 59.4% and 62.2% on built-up, forested areas and grasslands respectively.