Introduction
Floods occur when bodies of water overflow onto the surrounding land. Floods are one of the most common natural disasters in the world, caused by severe rainfall, fast urbanization, storm surges, and tsunamis. Vulnerability refers to the state of being exposed to the possibility of being attacked or harmed. Flood vulnerability mapping evaluates regions that are likely to be flooded; as a result, it’s an important part of flood risk management. Governments and individuals can plan ahead before a flood occurs, especially during the rainy season, by offering a spatial distribution of flood-prone areas, lowering the flood effect. As a result, the goal of this project is to use Geospatial Information Systems (GIS) and Analytical Hierarchy Process (AHP) approaches to analyse the flood vulnerability of five local government areas (Ibadan North, Ibadan North-East, Ibadan North-West, Ibadan South-East, and Ibadan South-West) in Ibadan metropolis, Oyo state.
Study Area
The research region consists five urban local government (Ibadan North, Ibadan North-East, Ibadan North-West, Ibadan South-East, and Ibadan South-West) in Ibadan metropolitan area, Oyo state. It is located between latitudes 7°18'41" N and 7°26'35" N and longitudes 3°49'52" E and 3°57'16" E. It has an area of 136 square kilometres and elevation of 192.829m above mean sea level.
Materials / Data
The project depends on open source or secondary data from different sources, they are listed below:
30m SRTM DEM
2021 Rainfall (mm)
Administrative boundary shapefile
Methodology
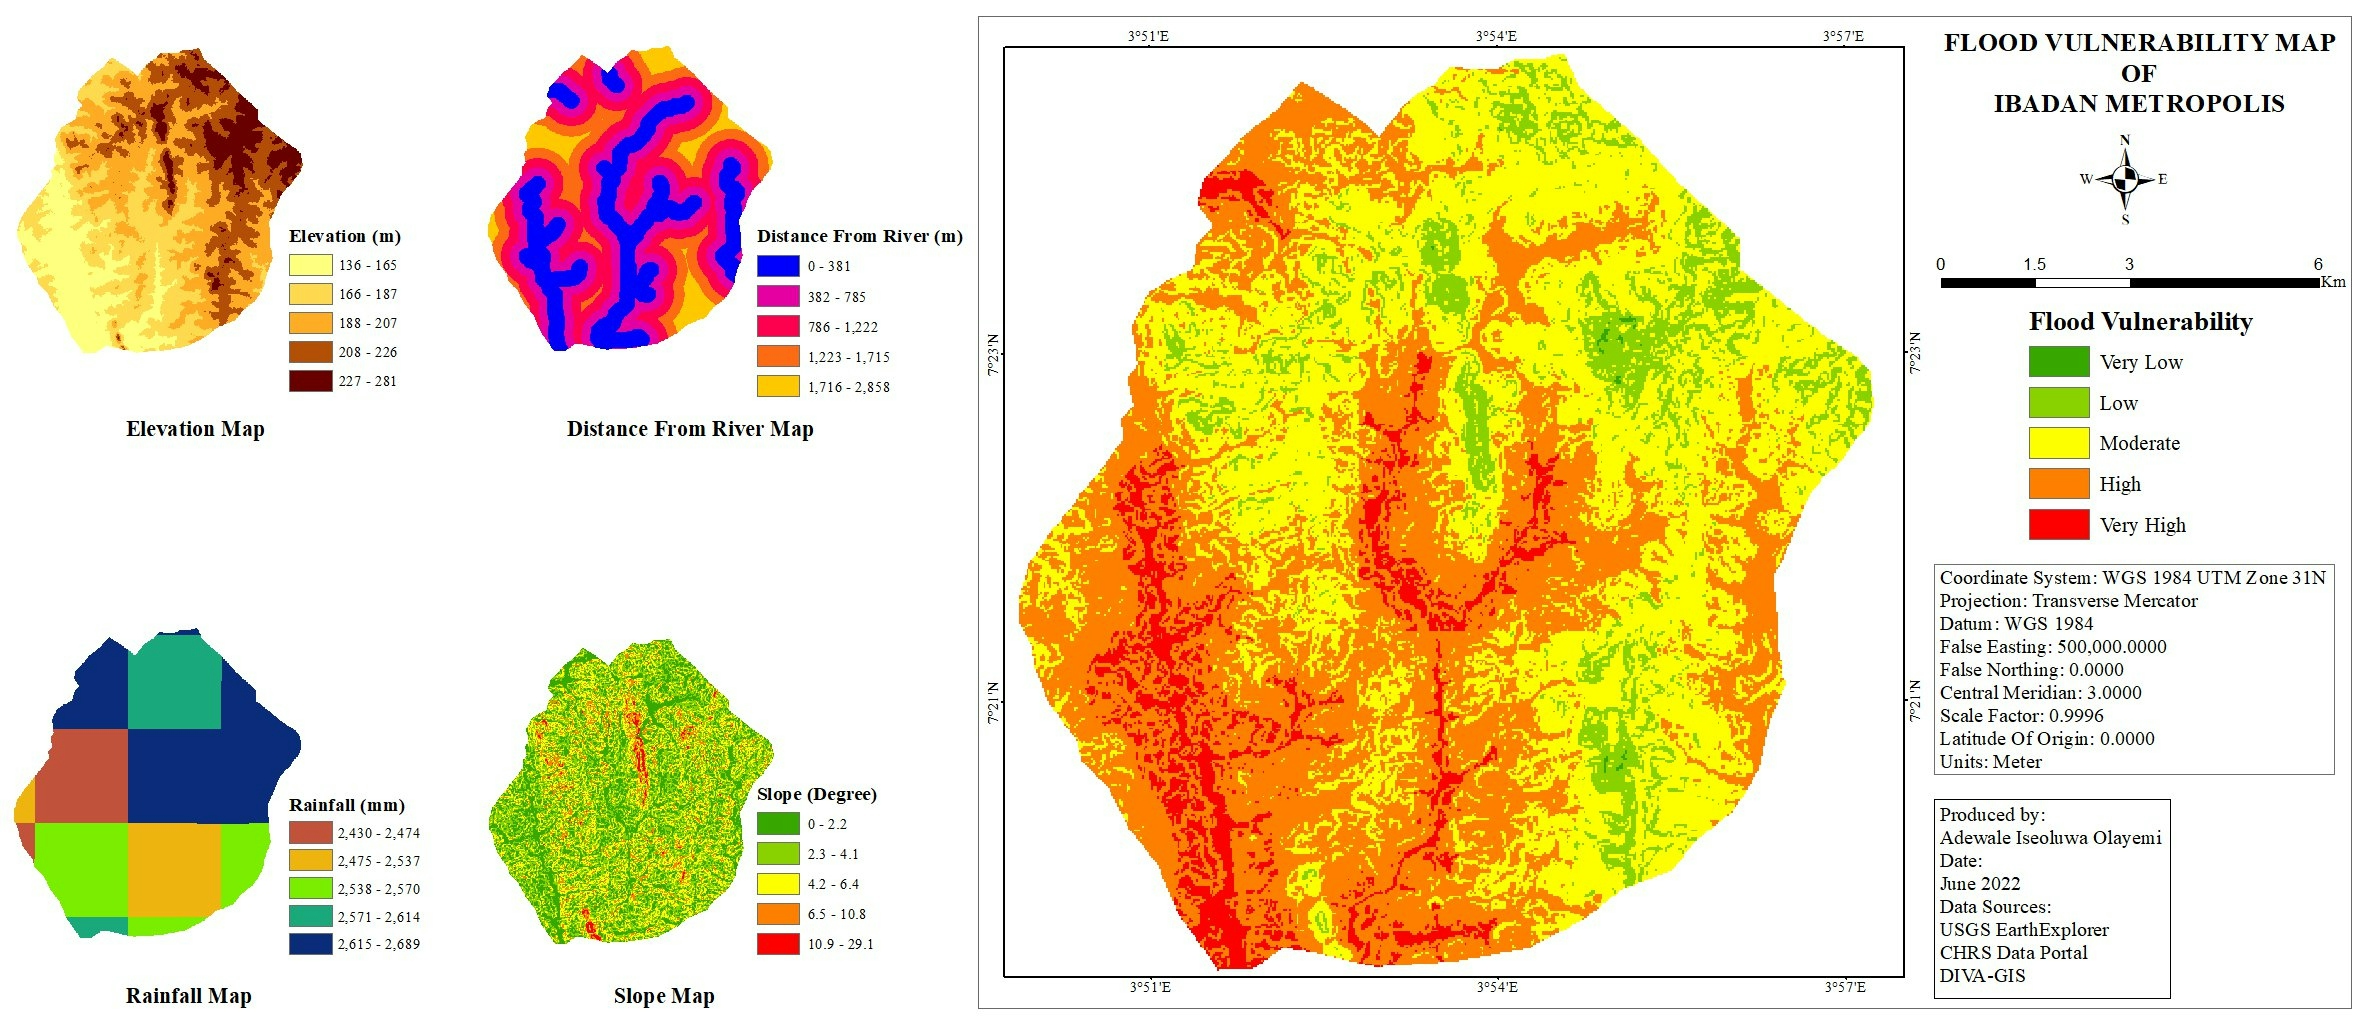
Data pre-processing methods such as datum harmonization (WGS84 UTM ZONE 31N), DEM filling, and extraction by mask were performed on the acquired data prior to the actual data analysis. The flood vulnerability map was created using four flood factors/indicators: elevation, slope, distance from river, and rainfall.
The elevation raster was created using the Digital Elevation Model (DEM). Water flows from higher elevations to lower elevations, making low-elevation areas more vulnerable to flooding than high-elevation areas. Using the slope tool in ArcGIS, a slope (degree) raster was created from the DEM raster. Those with a very high slope will drain water faster, lowering the risk of flooding, whereas areas with a very low slope will retain water during rainfall. The streamlines were created using the ArcGIS hydrology toolbox, and then Euclidean distance tool was used to calculate distance from the river/stream raster. Furthermore, all four thematic layers (elevation, slope, rainfall, and distance from river) were reclassified into a flood vulnerability scale/level (1–5), where 1- very low; 2-low; 3-moderate; 4-high; and 5-very high.
Analytical Hierarchy Process, developed by Thomas L. Saaty was used to determine the weight of each flood factors. The following weights were assigned:
Elevation — 43%
Slope — 31%
Distance from River — 15%
Rainfall — 11%
Weighted Overlay tool in ArcGIS was used to create the flood vulnerability raster layer. It’s a tool that uses a common measuring scale to calculate a multiple-criteria analysis between rasters and weights each raster according to its influence. To produce the flood vulnerability raster, the cell values of each reclassified flood factors were multiplied by their weight and the results were combined together. It’s worth noting that the result of the weighted overlay analysis is an integer value.
Results
The flood factors map are shown above. Each of these factors were classified into five different classes. The flood vulnerability map was produced with five flood vulnerability level, which are very low, low, moderate, high, and very high. Area of 0.096sq.km, 11.665sq.km, 57.035sq.km, 57.759sq.km, 9.413sq.km correspond to very low, low, moderate, high, and very high flood vulnerability respectively.
Conclusions
Flood vulnerability mapping is one of the most successful ways to reduce flood risk because it allows individuals, governments, and other stakeholders to have an overview of flood-prone areas and plan ahead of time for flood events. Using AHP and GIS methodologies, this study assessed flood-prone locations by creating a flood vulnerability map at five different levels (very low, low, moderate, high, and very high).