ANALYSIS OF THE RELATIONSHIP BETWEEN NDVI AND LST IN ABEOKUTA, OGUN STATE
Introduction
Normalized Difference Vegetation Index (NDVI) is an indicator that is used to assess green vegetation from remote sensed images. Near-infrared light is strongly reflected by healthy vegetation, but red light is strongly absorbed. NDVI value ranges from -1 to +1. High values (close to +1) correspond to healthy/dense vegetation, while negative values represent water. Low values that are close to zero could be rock, barren land, snow, or urban areas.
Land surface temperature (LST) is the temperature at which the Earth’s surface would feel to the touch in a certain area. LST is retrieved from the thermal band of a remotely sensed image. It is an important parameter that is used to study climate change, crop monitoring, detection of urban heat, etc.
As a result, the aim of this project is to assess the relationship between NDVI and LST in the study area.
Objectives
- To determine different land cover classes in the study area.
- To extract NDVI .
- To retrieve LST from satellite image.
- To analyze the relationship between NDVI and LST.
Study Area
The study area is Abeokuta city, Ogun State, Nigeria. Abeokuta covers two local government areas, which are Abeokuta South and Abeokuta North. It lies between longitudes 3° 00’ 00’’ - 3°24’20’’E and latitudes 7° 04’ 03’’ - 7° 25’ 08’’N, and spans an area of about 867sq.km.
Methodology
The satellite image (Landsat) was classified into four different classes (water body, vegetation, bare land, and built-up area) using the Maximum Likelihood Classification algorithm.
NDVI of the study area was calculated using the equation below
- NDVI = (NIR -RED)/(NIR+RED)
where NIR is spectral reflectance in the near-infrared band and Red is spectral reflectance in the red band
LST was retrieved using the Landsat 8 thermal band. This process involved three major steps:
- Conversion of Digital Number to Spectral Radiance
- Conversion of Spectral Radiance to TOA Brightness Temperature
- Conversion of TOA Brightness Temperature to Land Surface Temperature (LST)
1000 random sample points were generated to determine the Pearson’s correlation between NDVI and LST.
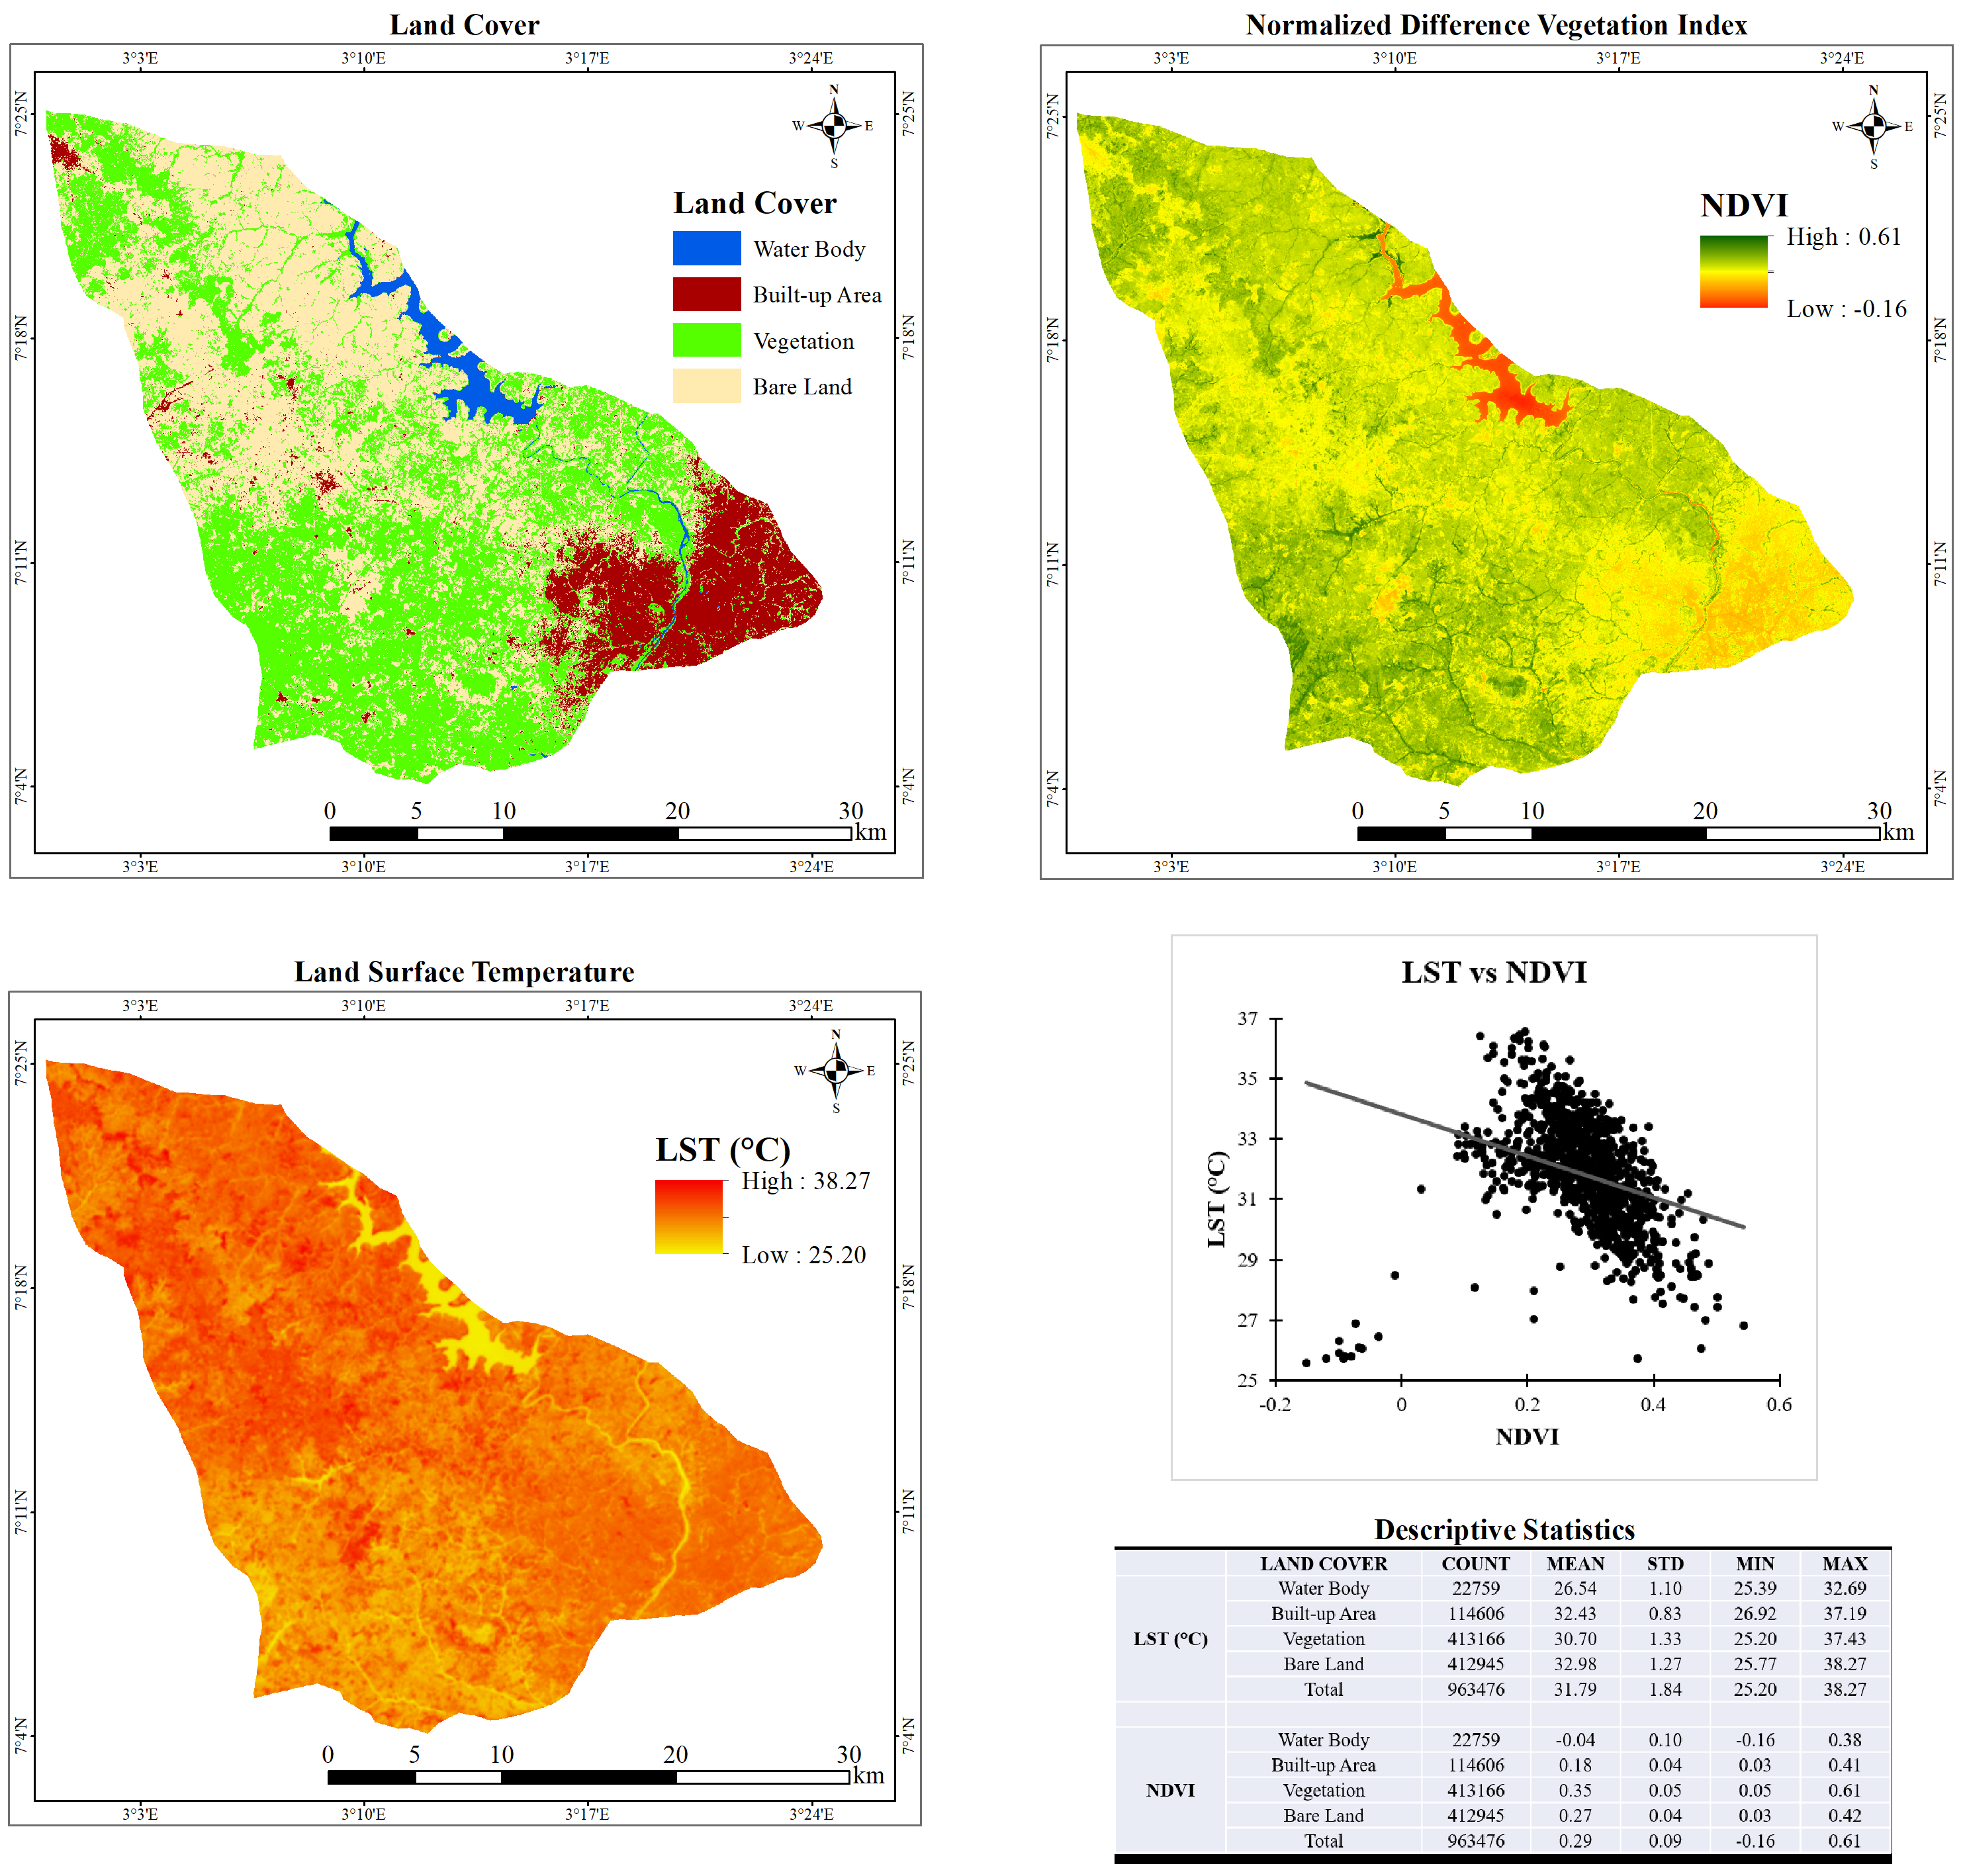
Results
The study area was classified into four land cover classes (Built-up area, Vegetation, Water body, and Bare land). Water body had the lowest mean temperature while bare land had the highest mean temperature. NDVI values ranged from -0.16 to 0.61, vegetation had the highest mean NDVI, while water body had the lowest mean NDVI. The Pearson’s correlation coefficient (r) between LST and NDVI indicates a negative correlation (r = -0.32).