Bridging the gap between spatial analysis software and 3D graphic software has resulted to understanding the concept behind each software and to learning how these software (ArcGIS/QGIS and Blender) are interconnected and being utilized. One of the great ways to show the potential of these software is creating 3D-like map from 2D data.
About Italy
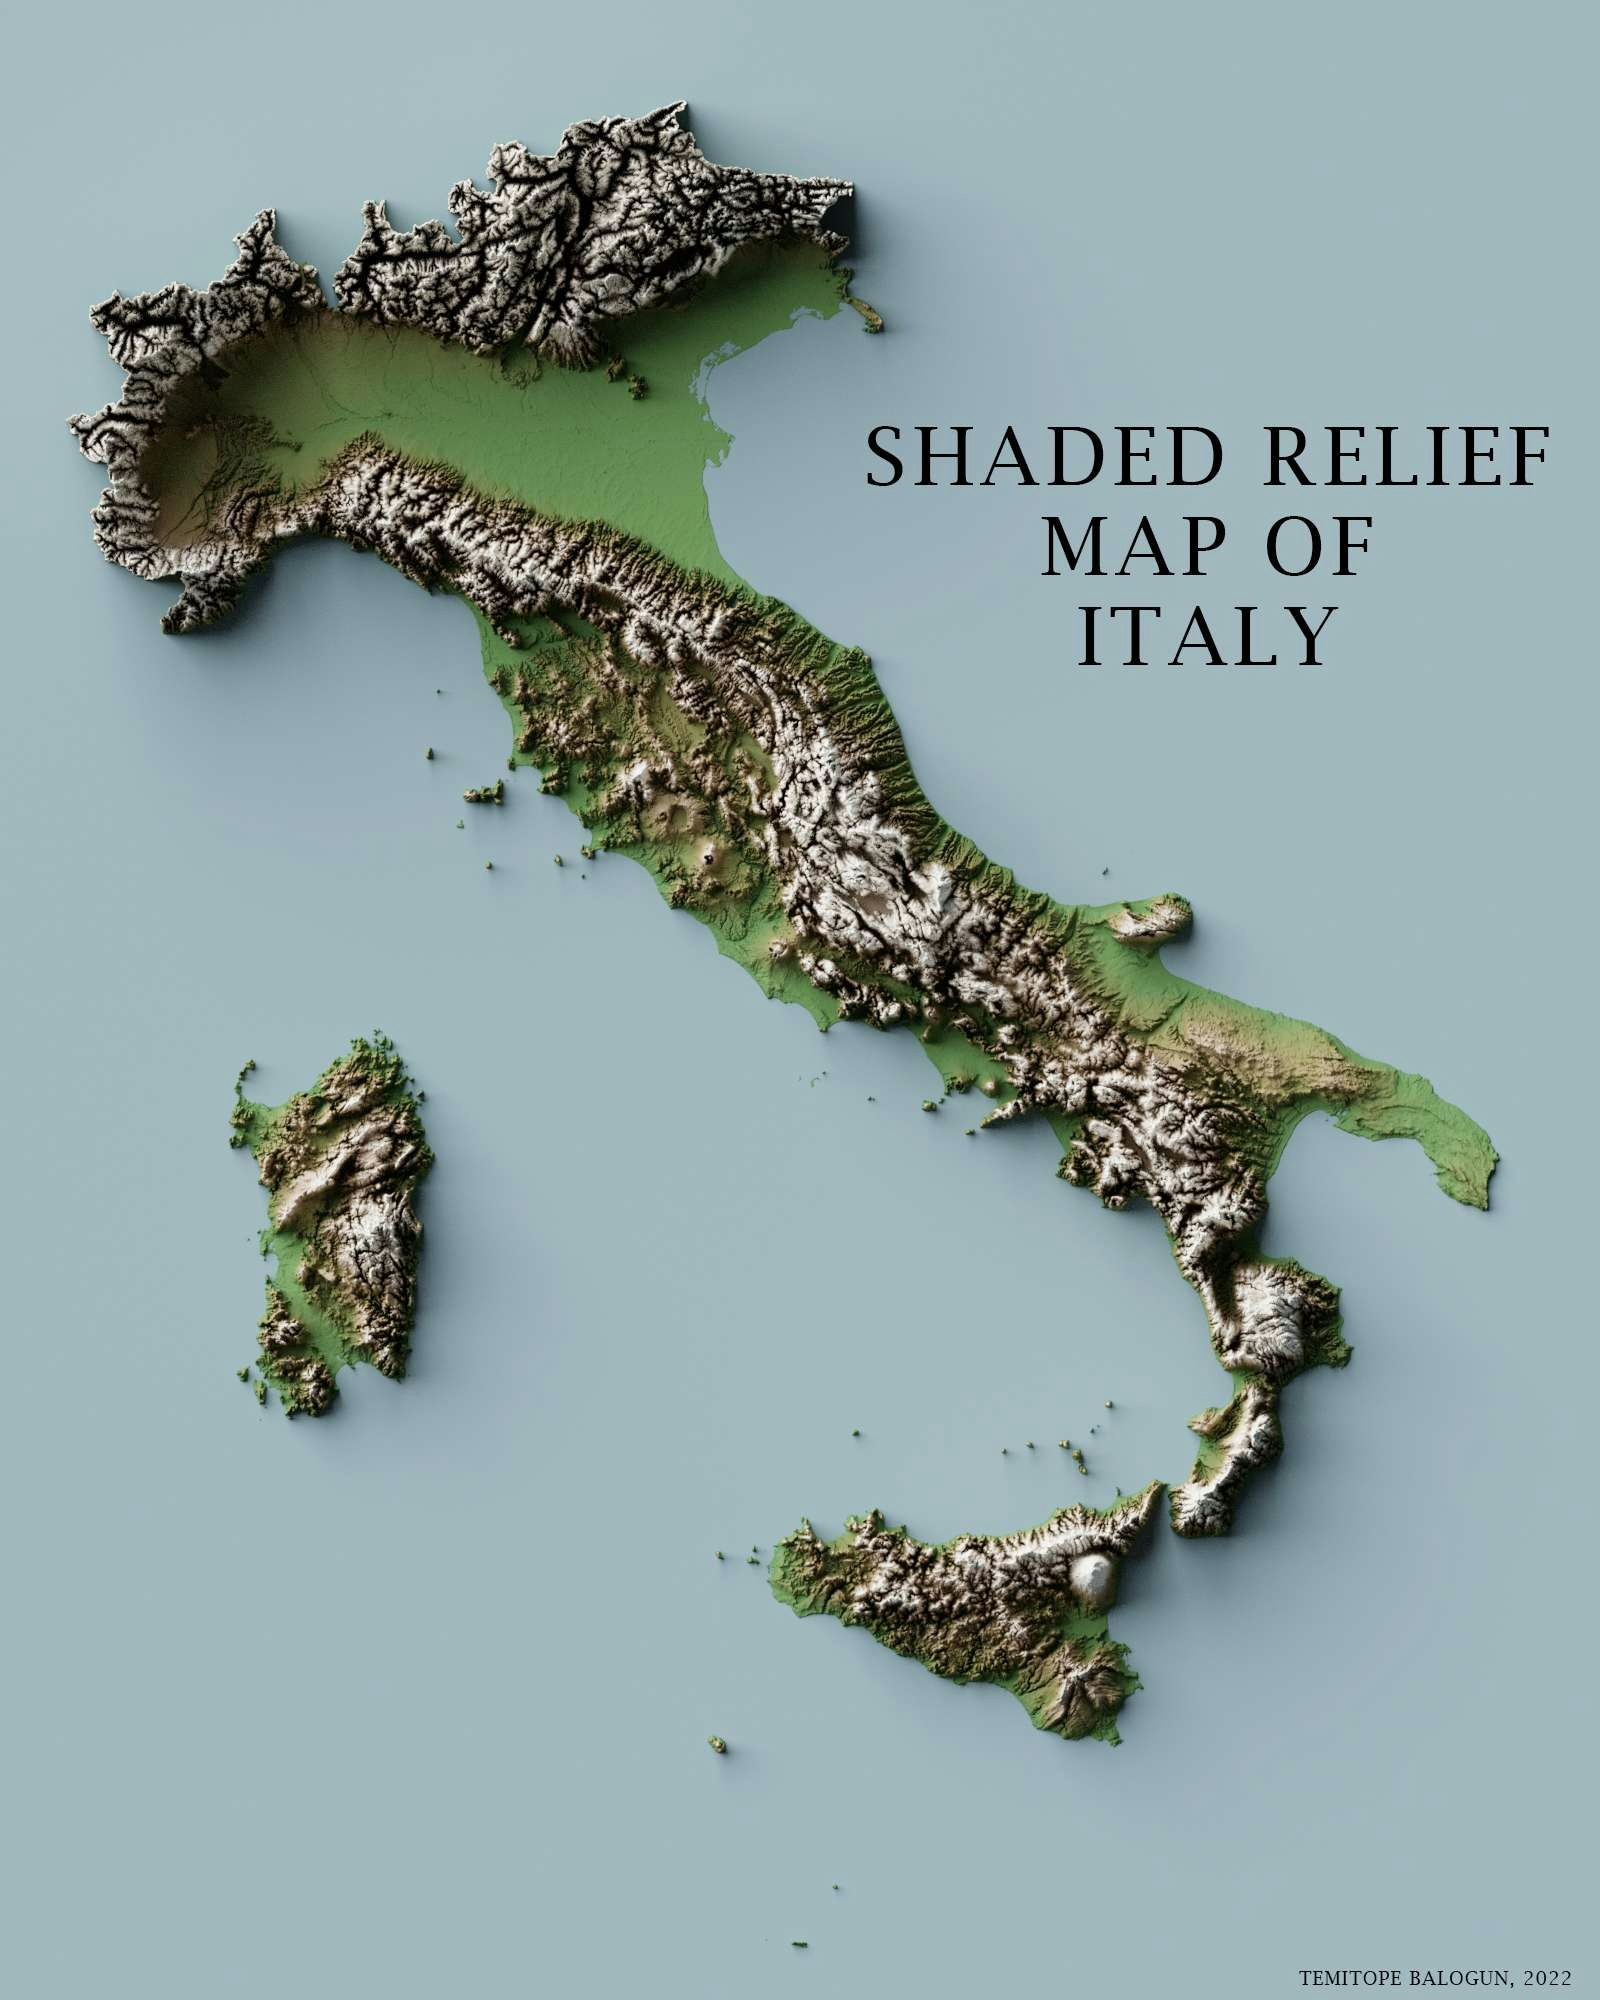
Italy is one of the European countries which consists of a peninsula delimited by the Alps and several islands surrounding it. Over 35% of the Italian territory is mountainous. Except for the fertile Po Valley within side of the north and the slim coastal belts farther south, Italy's mainland is usually mountainous, with widespread seismic activity. According to topographic map, Minimum elevation of Italy is -2 m while Maximum elevation: 4,424 m.
About the map
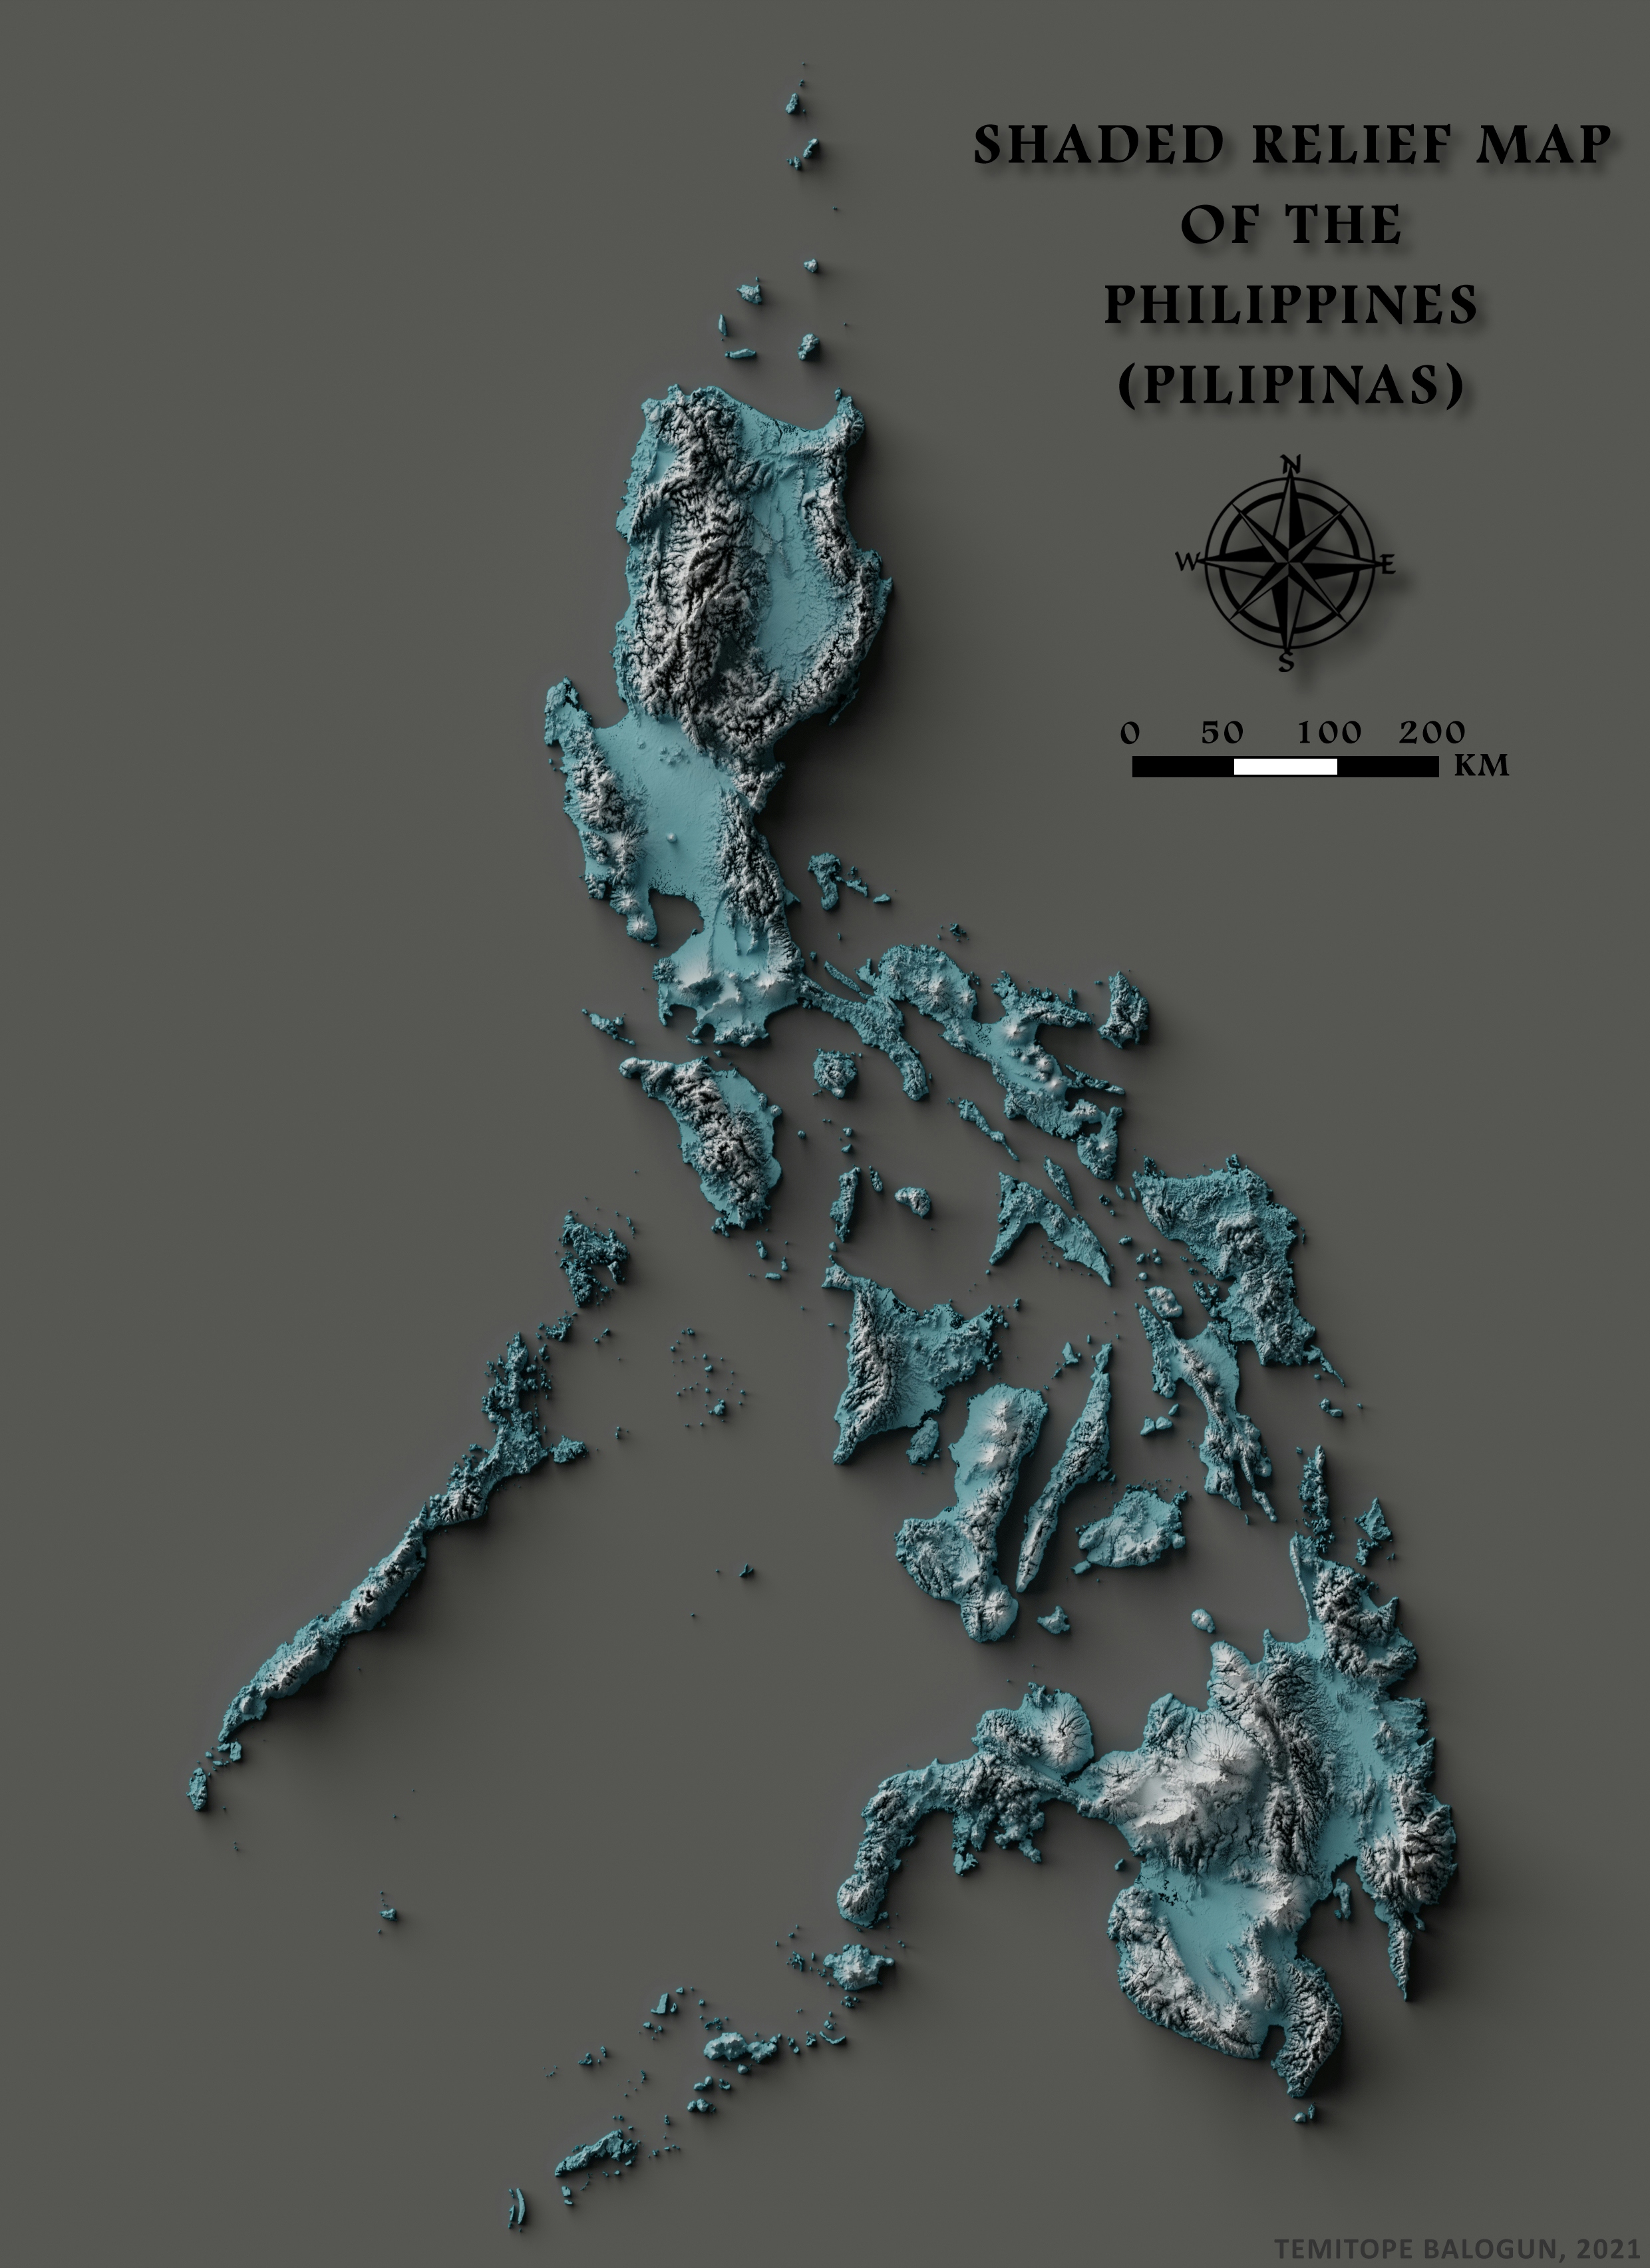
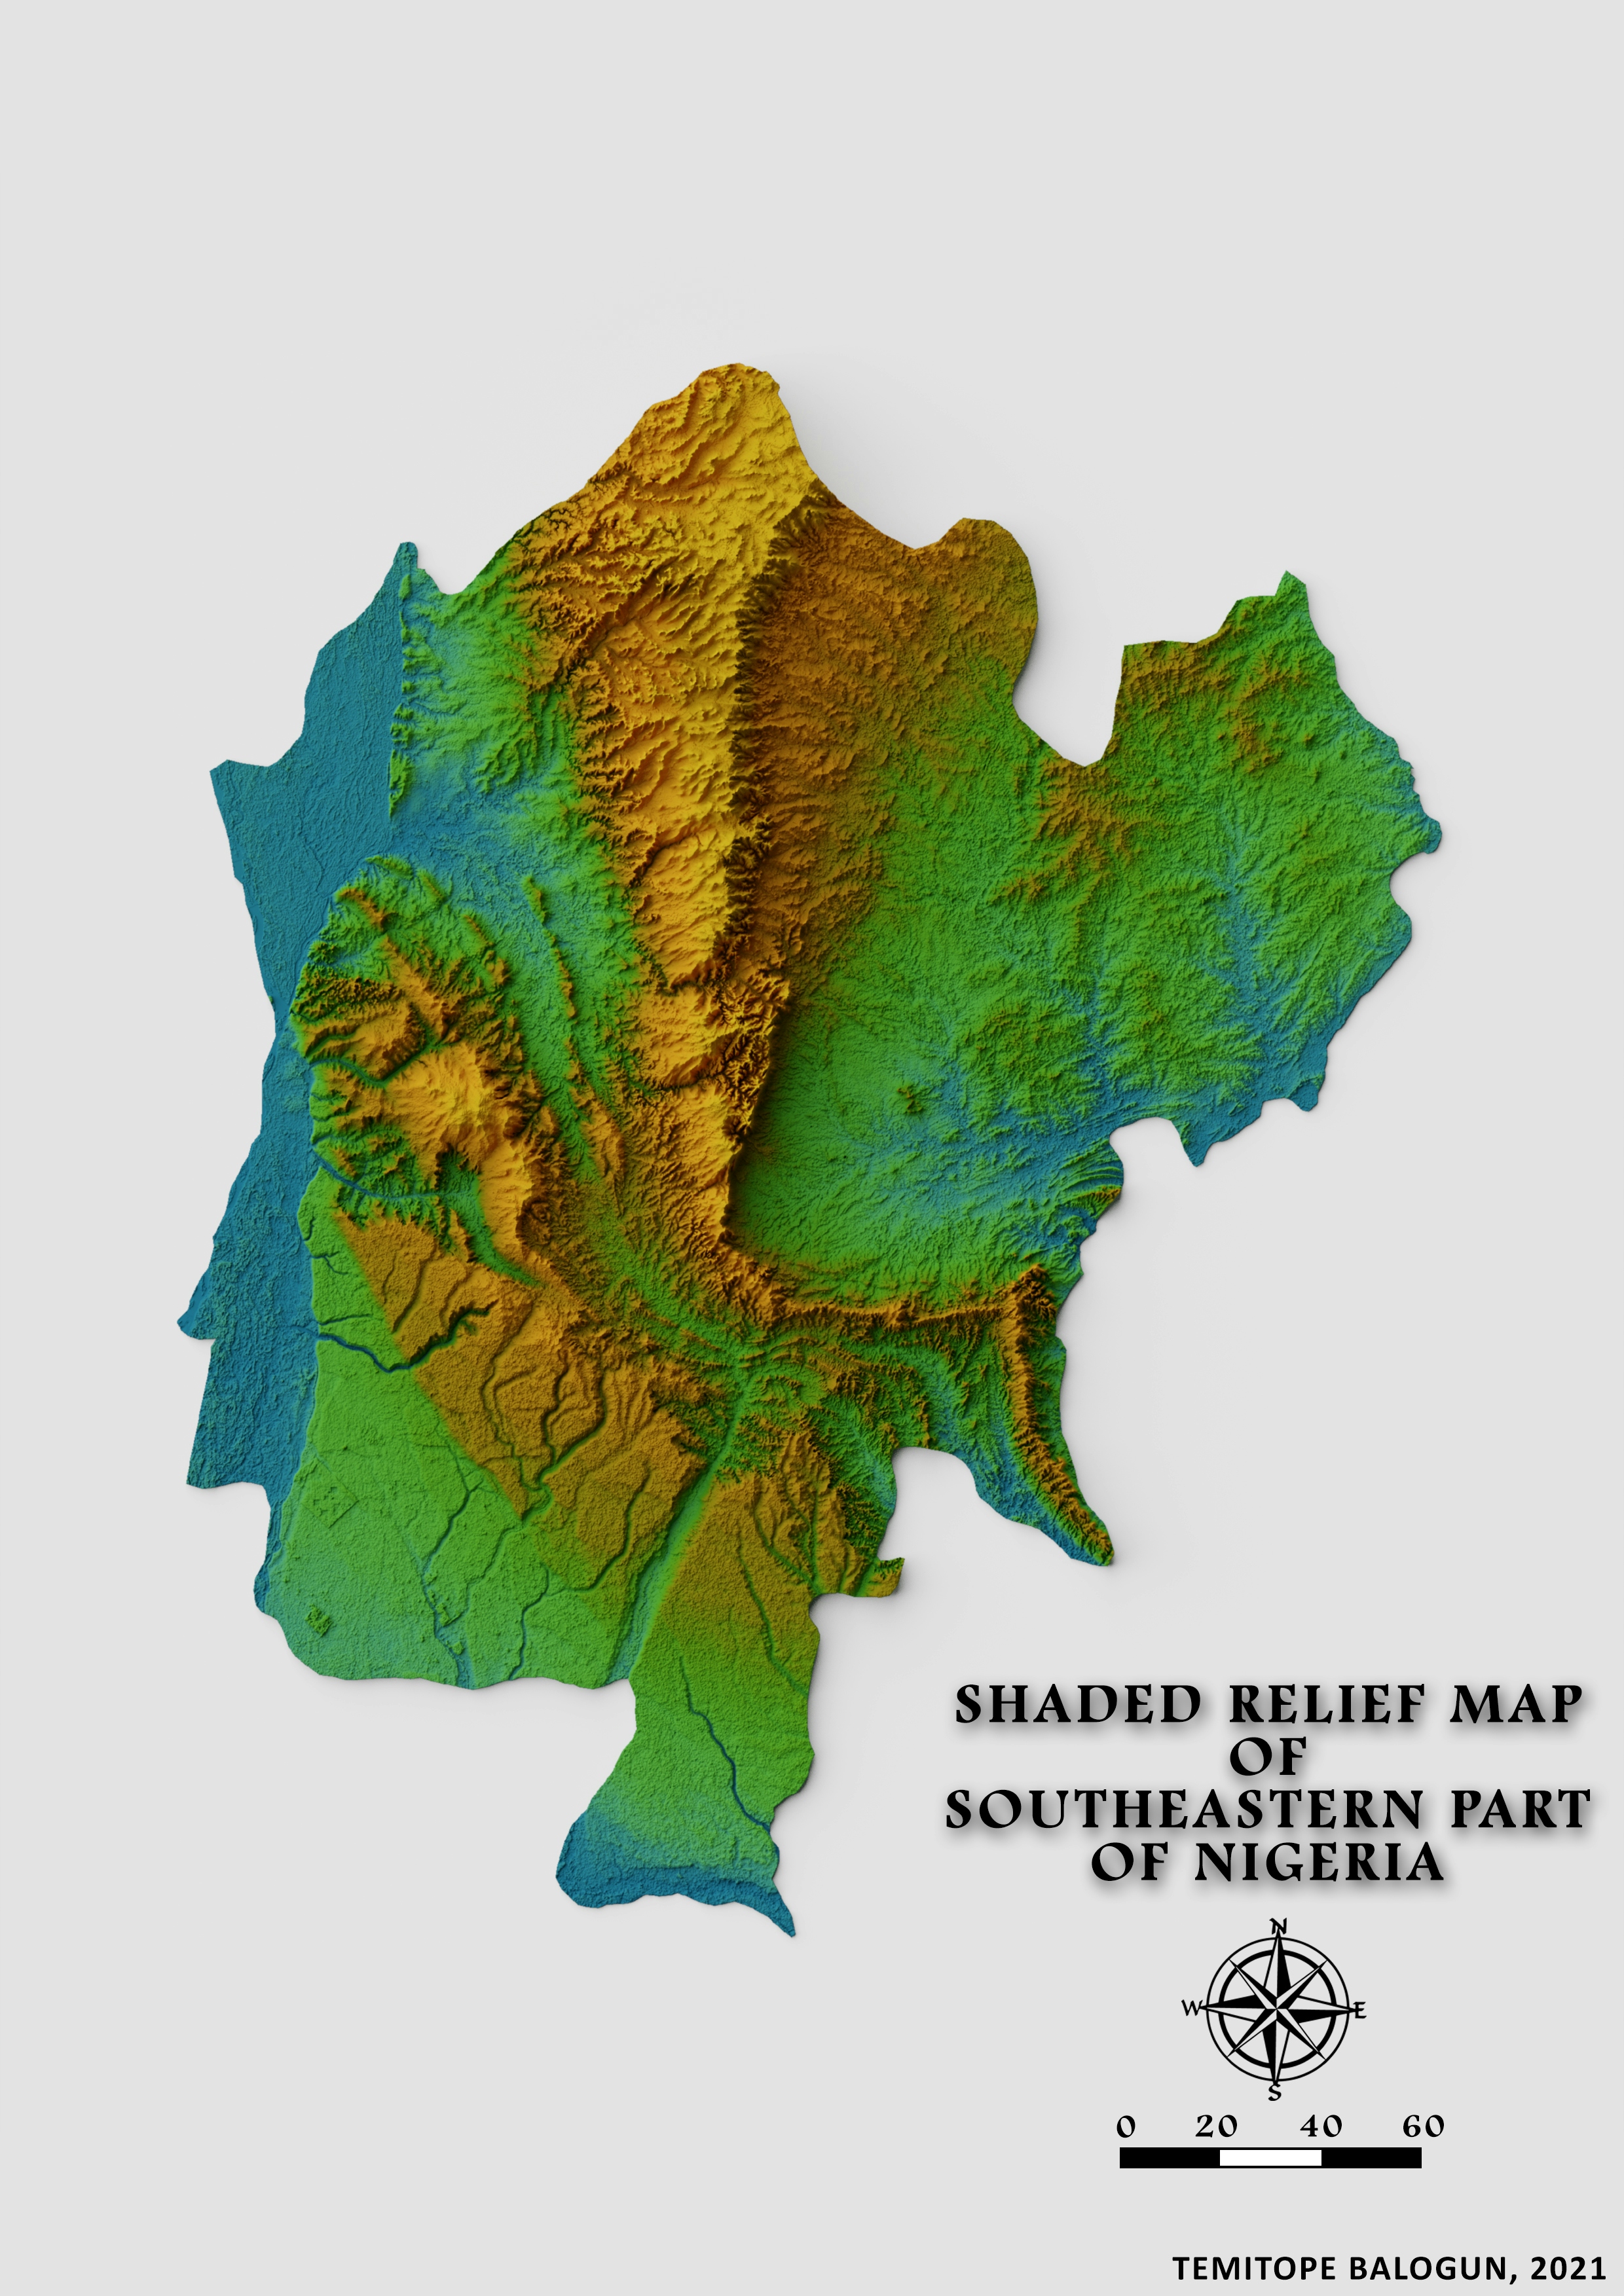
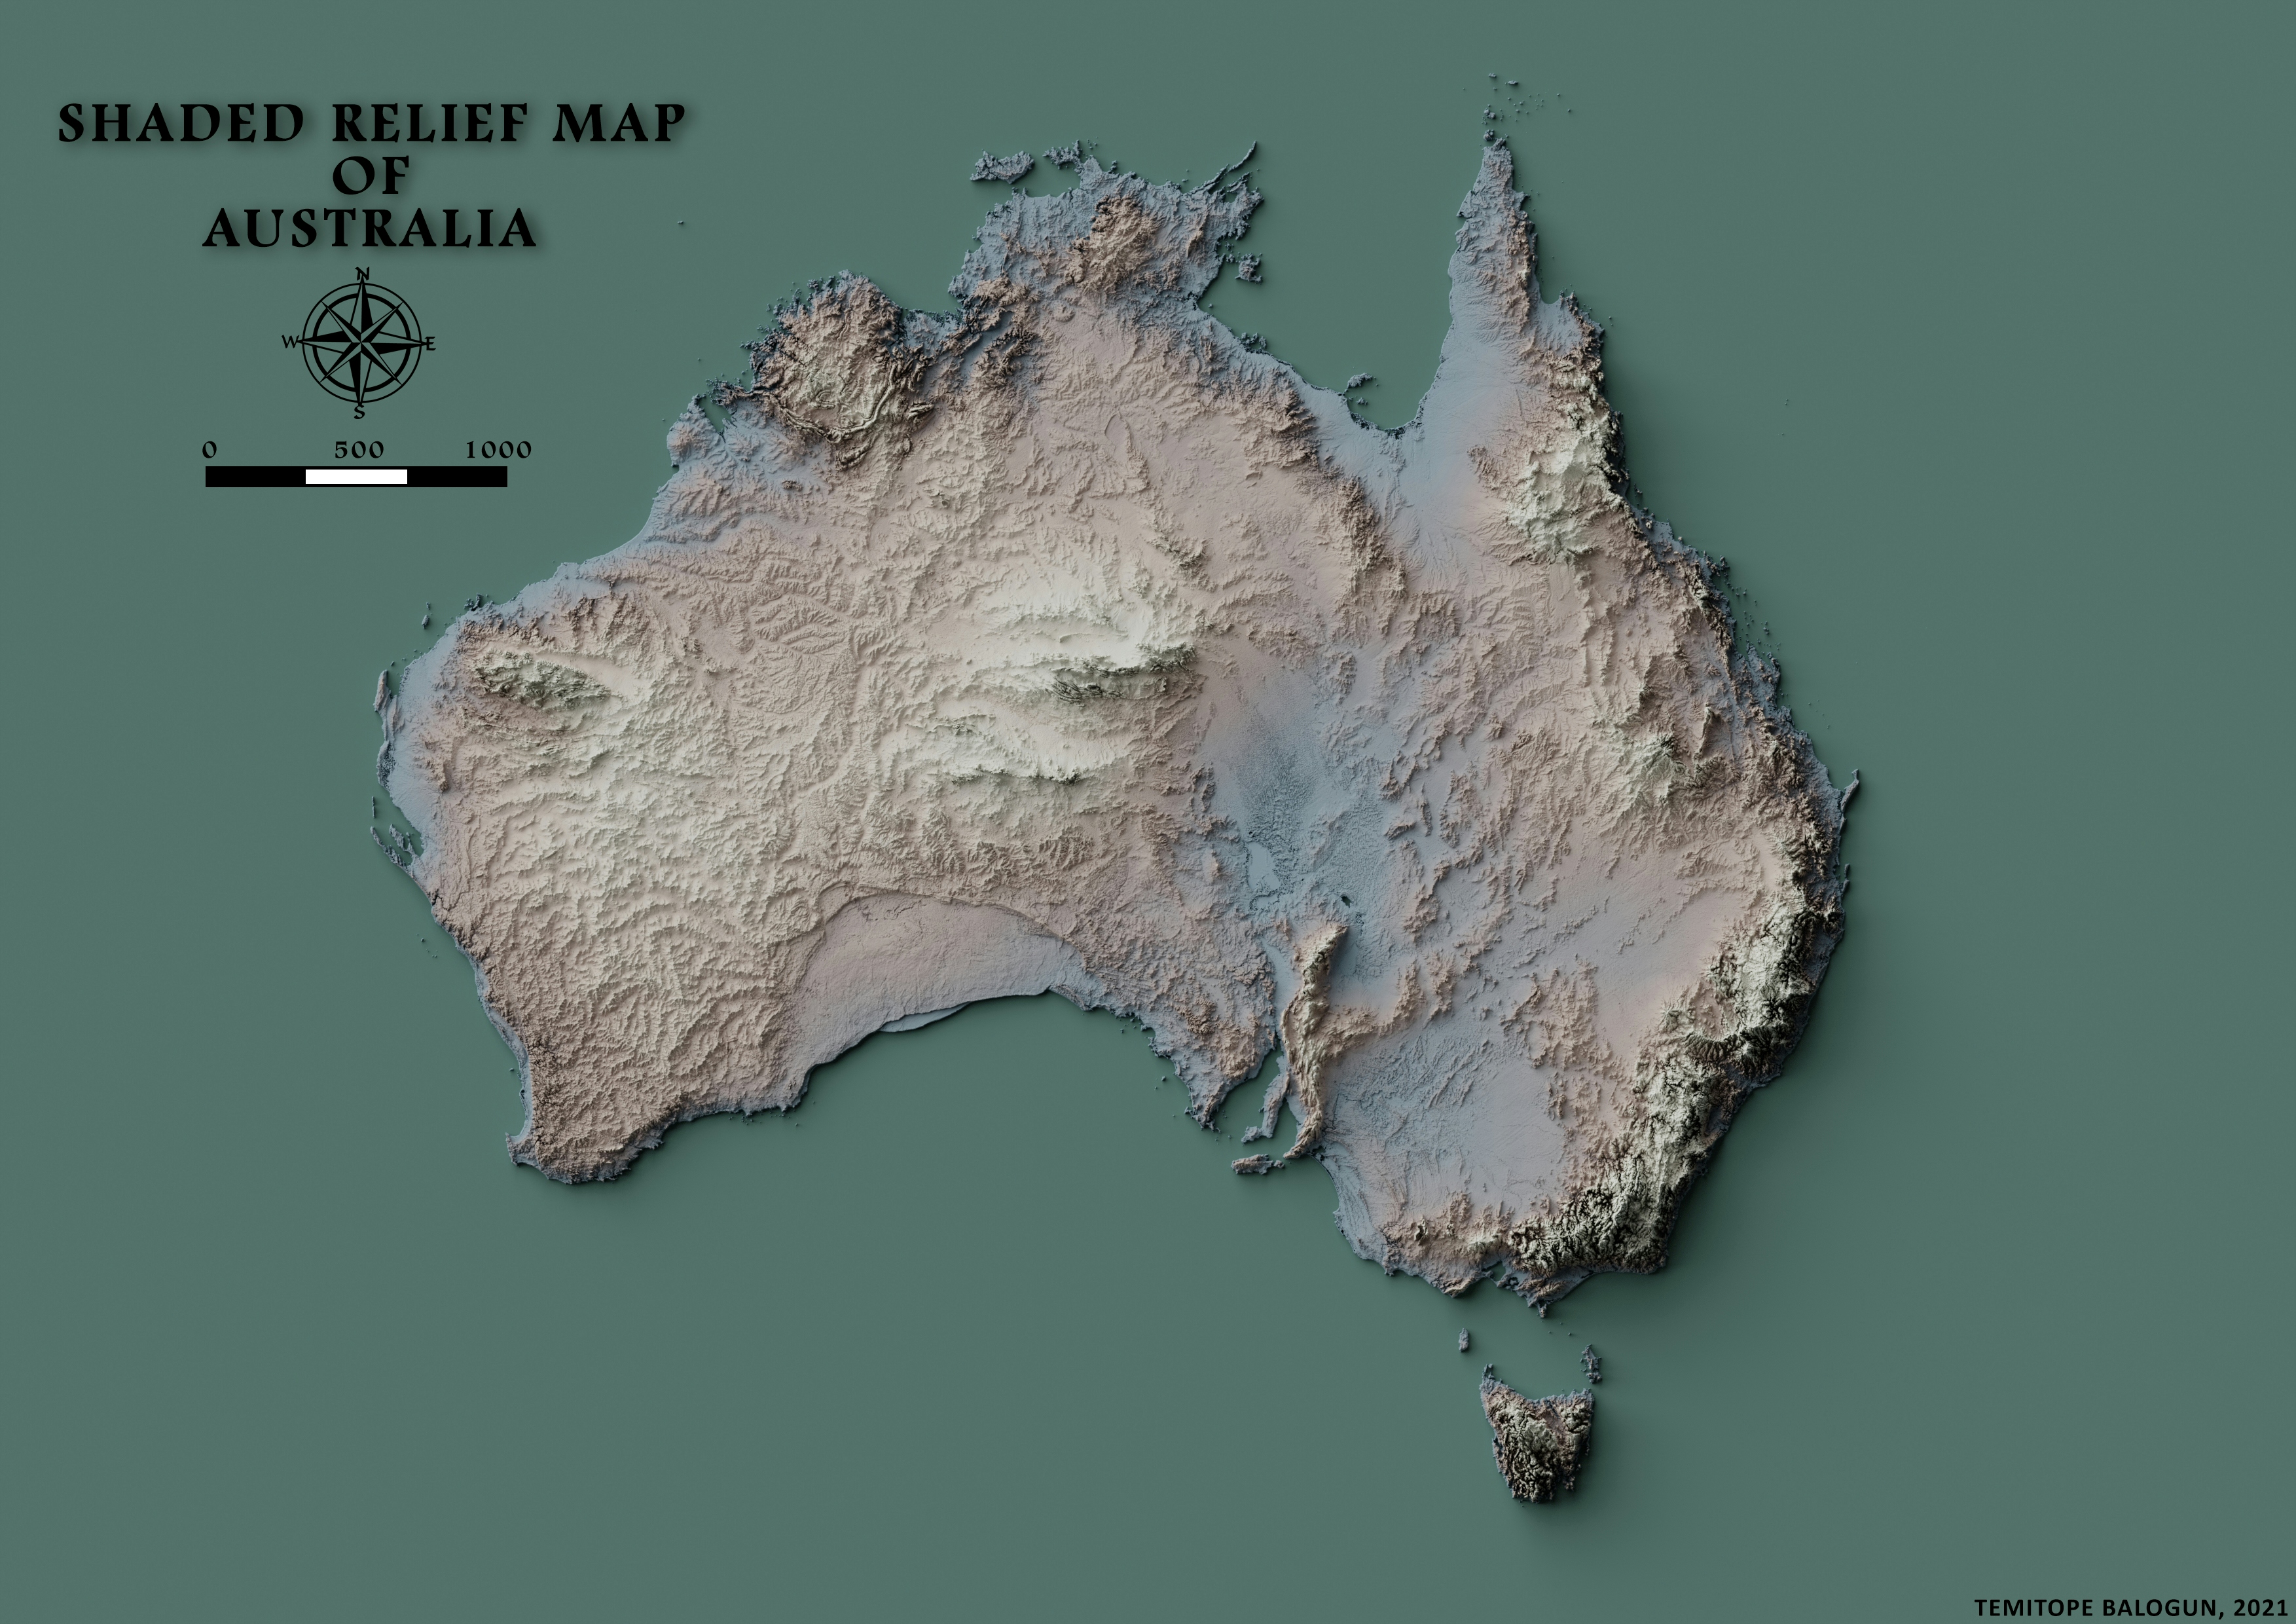
This map shows the shape of Italy terrain in a realistic fashion. On the map, The Po River Valley is visible at the northern part of the map shaded in green color.
Methodology
Tile of DEM that covers Italy was downloaded from GMTED2010 website while the shapefile of Italy was downloaded from Diva-GIS website. This DEM was Imported into ArcMAP for preprocessing. Shapefile was also imported. This preprocessing involves reprojecting, Clipping, resampling. rescaling and changing of DEM bit. The DEM was reprojected from geographic coordinate system to projected coordinate system (A suitable projected coordinate was chosen from EPSG Website). The DEM was clipped out using the shapefile. After clipping, DEM was resampled using resample tool. rescaling, changing of bit to 16bit and saving as tiff was implemented before importing the DEM into Blender
This DEM was displaced on blender in a way that the white and grey parts of the DEM shifted up to indicate high elevation. Now we have a relief map. Sun direction and angle was set and camera direction and angle was set to give the relief a stunning look. Color Node was used to shade the relief map according to their elevation.
Inspiration
Daniel Huffman, Maguel Velenzuela, Owen Powell and more cartographers are the inspiration behind this project. John Nelson has got some insightful tutorial on youtube.
Don't hesitate to contact me via my profile link if you want to know more about the shaded relief maps.
You can as well check out my NFT map project here


.svg "Keran Nkongolo")