
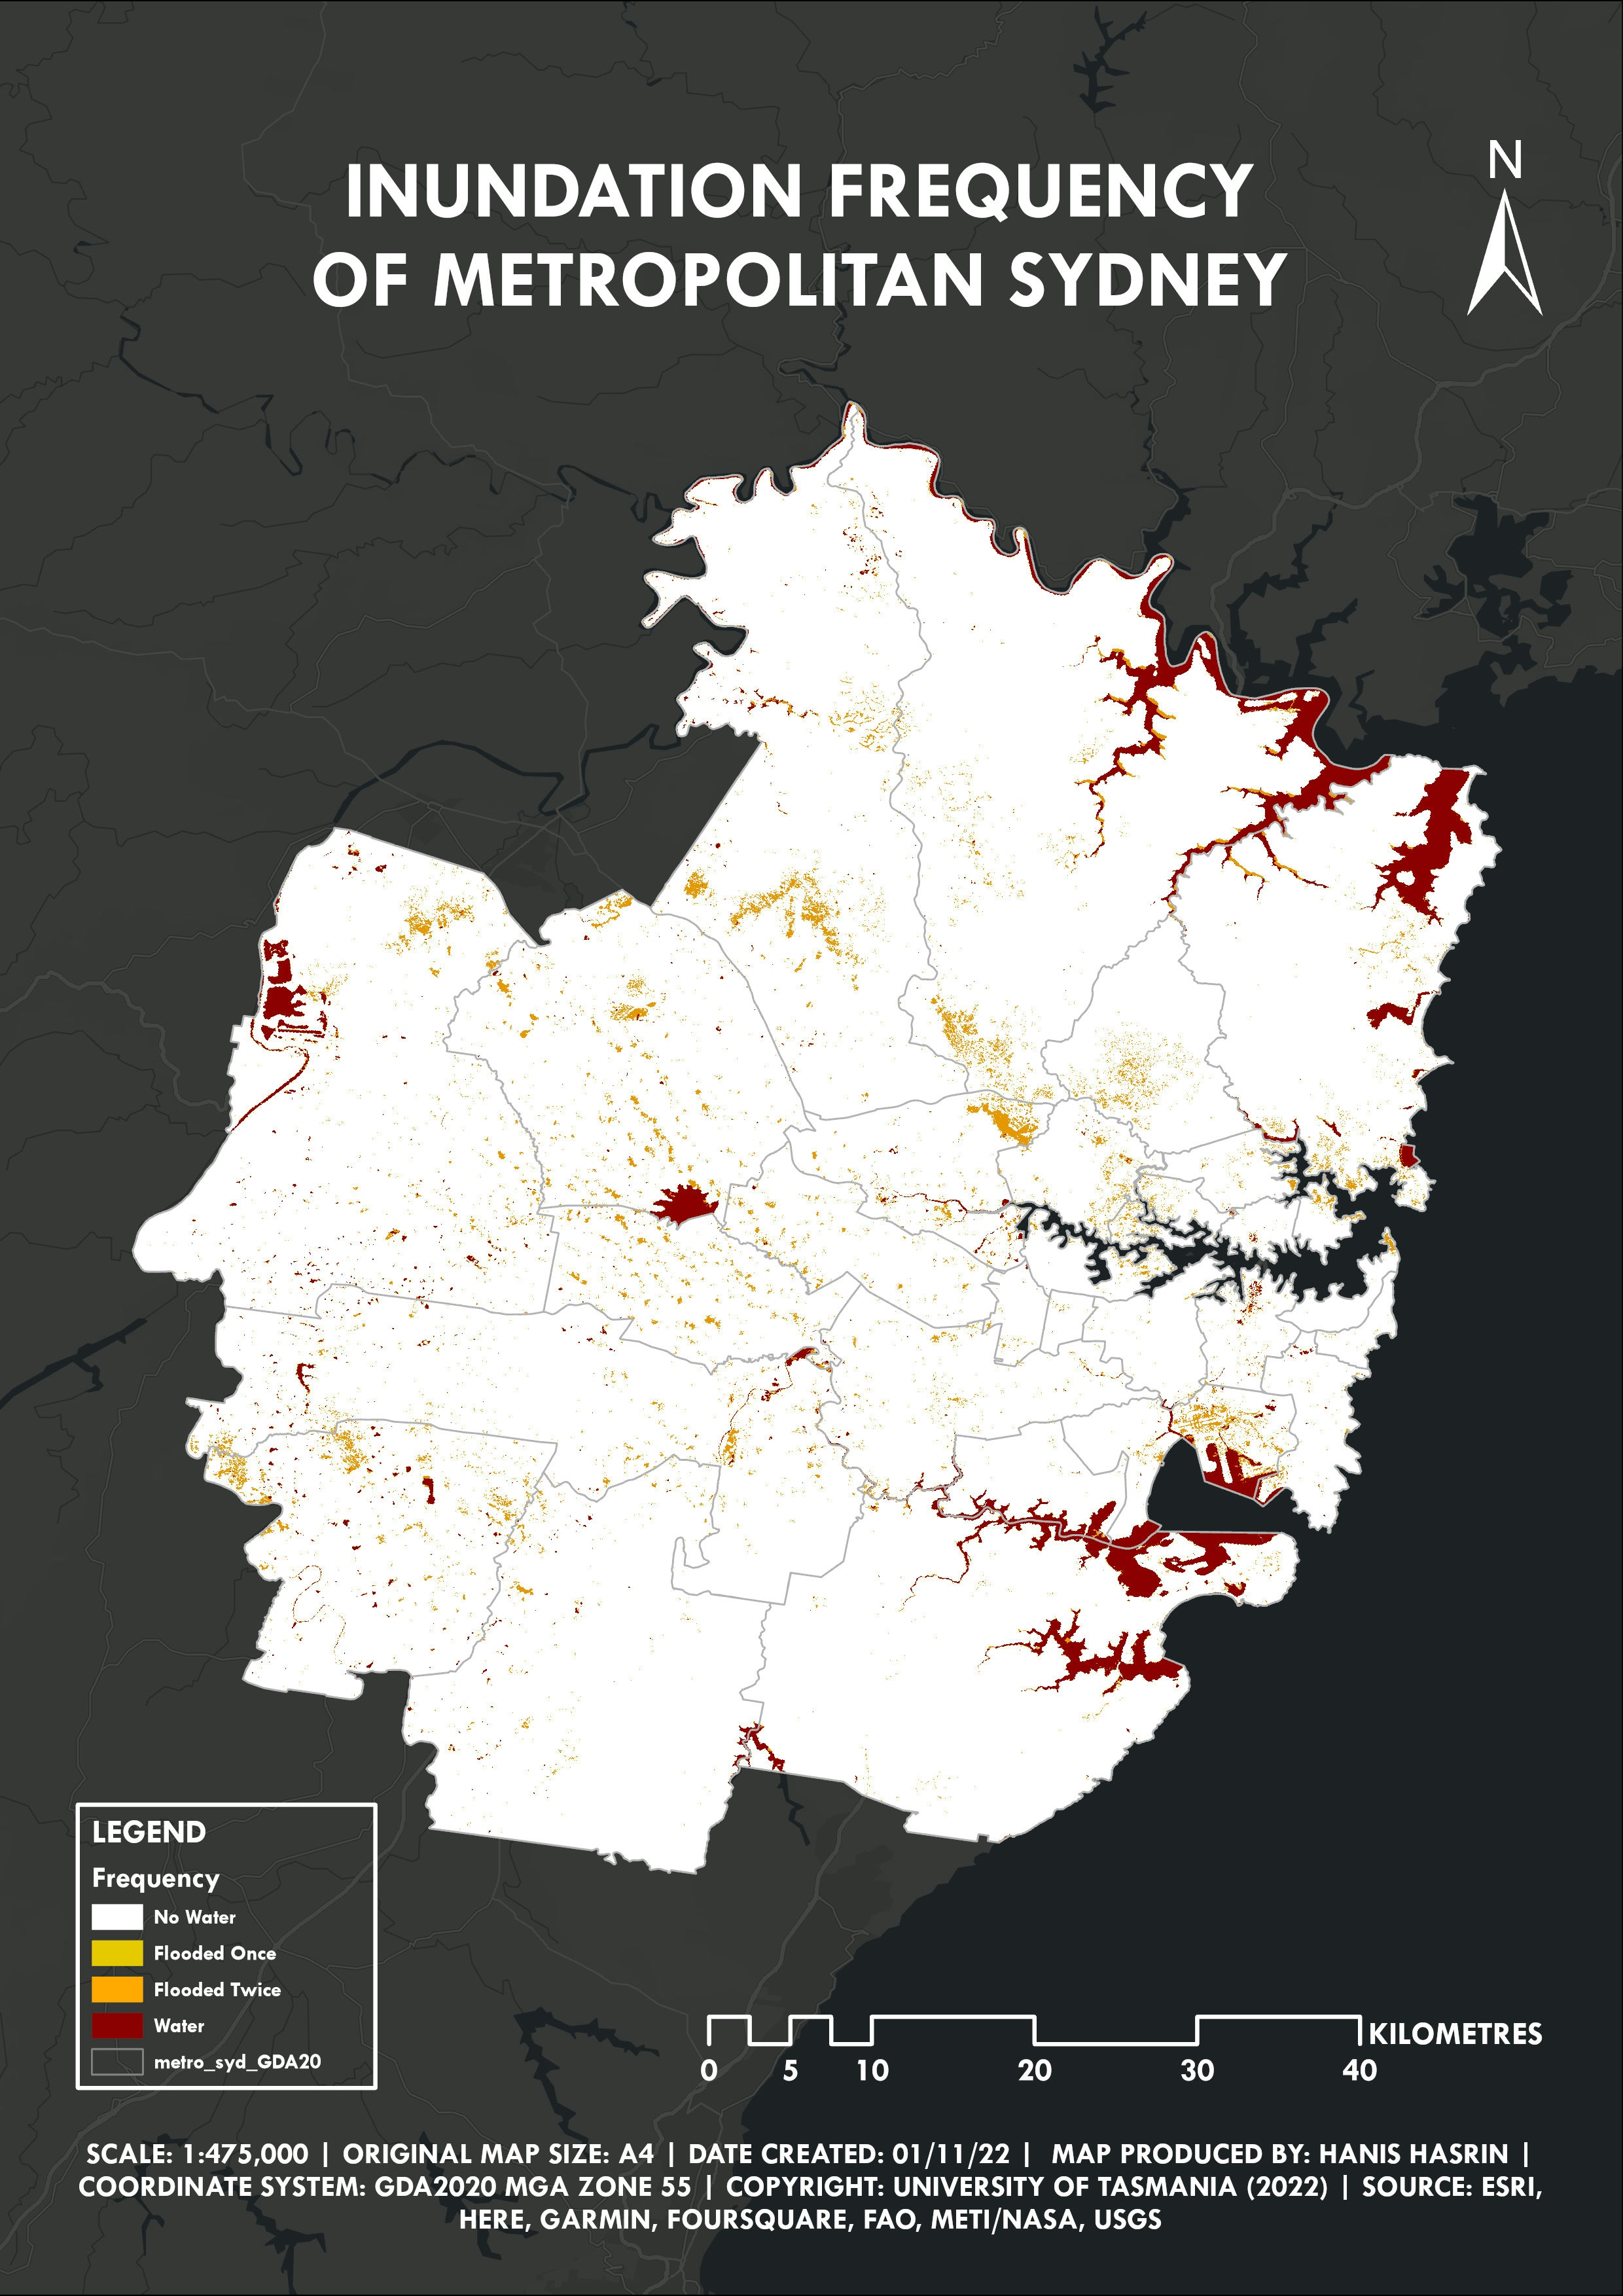
Satellite imagery before, during and after the flooding period were obtained
from Water Observations from Space (WOfS), an online service providing surface water
observations from satellite data for Australia from the year 1987 to present. An algorithm provided
by Digital Earth Australia (DEA) Water Observations were then being used to classify each pixel
from the LandSat satellite imagery previously obtained to further classify the pixels as either ‘wet’,
‘dry’ or ‘no-data’ pixels, with a threshold of at least 70% of the pixels being of either water (wet)
or ground (dry). Subsequently, zonal statistics were being performed on the three selected imagery
to calculate the percentage of water pixels covering each scenario, which was then being calculated
using the ‘raster calculator’ function in ArcGIS Pro with the equation ‘sum/count * 100%’. Finally,
maps were being produced via the ArcGIS Pro software, whereas graphs and tables were being
made on Microsoft Excel.
Innundation Frequency
Tools used
Zonal Statistics
Plug-ins used
ArcGIS
tags
Innundation Frequency
You might also like


![Projeto - Análise Espacial [1/2]](/_next/image?url=https%3A%2F%2Fstorage.googleapis.com%2Fspatialnodefiles%2Fprojects%2F9c96159b-e45d-4811-b8b1-236f8d9c3a98layoutmapametro.png&w=3840&q=100)


Join the community!
We're a place where geospatial professionals showcase their works and discover opportunities.