Introduction
The purpose of this paper is to answer the question: What has been the change in winter snowpack levels in Afghanistan over at least two distinct years? The Mountain snowpack is a main source of irrigation for agriculture in many parts of the country, with five river basins that originate in various mountain ranges. The importance of winter snowpack on agriculture is so great that even in years where these areas do receive adequate rainfall, drought risk is still a concern. Causes for major variations in the snowpack is directly related to climate change, which will also have an effect on mountain glaciers which will, in turn, have longer-lasting implications for irrigation and agriculture (United Nations Food Programme, 2016).
Varying levels of winter snowpack in Afghanistan can provide insight into several future areas of concern. The first and most obvious is that less winter snowpack means less water flow throughout the year, which in turn means a higher risk of drought which will have an adverse effect on agriculture yield. Famine can result in such a scenario, which itself can lead to increased rates of malnutrition, increased insecurity and internal conflict, increased cross-border migration, and increased demand for aid and humanitarian relief, among others (National Intelligence Council, 2021). Specifically for Afghanistan, many farmers may turn to poppy cultivation as a primary source of livelihood. Poppy is a more durable crop than more traditional food crops, more lucrative for farmers, and is a labor-intensive crop that also provides local jobs (United Nations Office on Drugs and Crime, 2019). Being that Afghanistan supplies 80% of the world’s opium, an increase in poppy cultivation would directly fuel the global heroin trade (United Nations Office on Drugs and Crime, 2021).
Methods
Imagery for this project I knew would not need to be of high spectral resolution, as my plan was to focus on a large region within Afghanistan known to be very mountainous, such as the northeast Hindu Kush area. Covering the entire country is not necessary as the scope of this project is to detect a change and not necessarily prove that snowpack coverage is decreasing across the entire country. Therefore, my intent was to use Landsat 8 imagery which has a 30m spectral resolution. Because I’d be focusing on snowpack, I had identified the months of January and February as ideal months, with March as a backup if adequate imagery for the primary months could not be obtained. Focus years would be the current year if possible and any other year within ten years prior. Ten percent or less of cloud coverage would be a level of cloud error that I deemed acceptable.
Another aspect that guided my search was to find a region of Afghanistan that not only showed snowpack in the mountains in the northeast of the country, but also a portion of a basin that its rivers feed. This would give me flexibility should I decide to also conduct a vegetation analysis in harvest months to assess how snowpack levels affect agriculture during the same year. Reinforcing these criteria is the fact that the eastern part of Afghanistan has also been found to be a part of the Indus basin also affected by snowpack (Biemans et al., 2019). These parameters led me to select the area around the city of Jalalabad, which is east of Kabul near the Pakistan border and is in the basin fed by the Hindu Kish mountains to the north and south. Jalalabad is the provincial capital of Nangarhar which has historically produced poppies. Ultimately the images selected for analysis were one entire Landsat 8 tile that focused on the city of Jalalabad and surrounding mountains for the months of January and/or February of the years 2021 and 2017 with 10% cloud coverage or less.
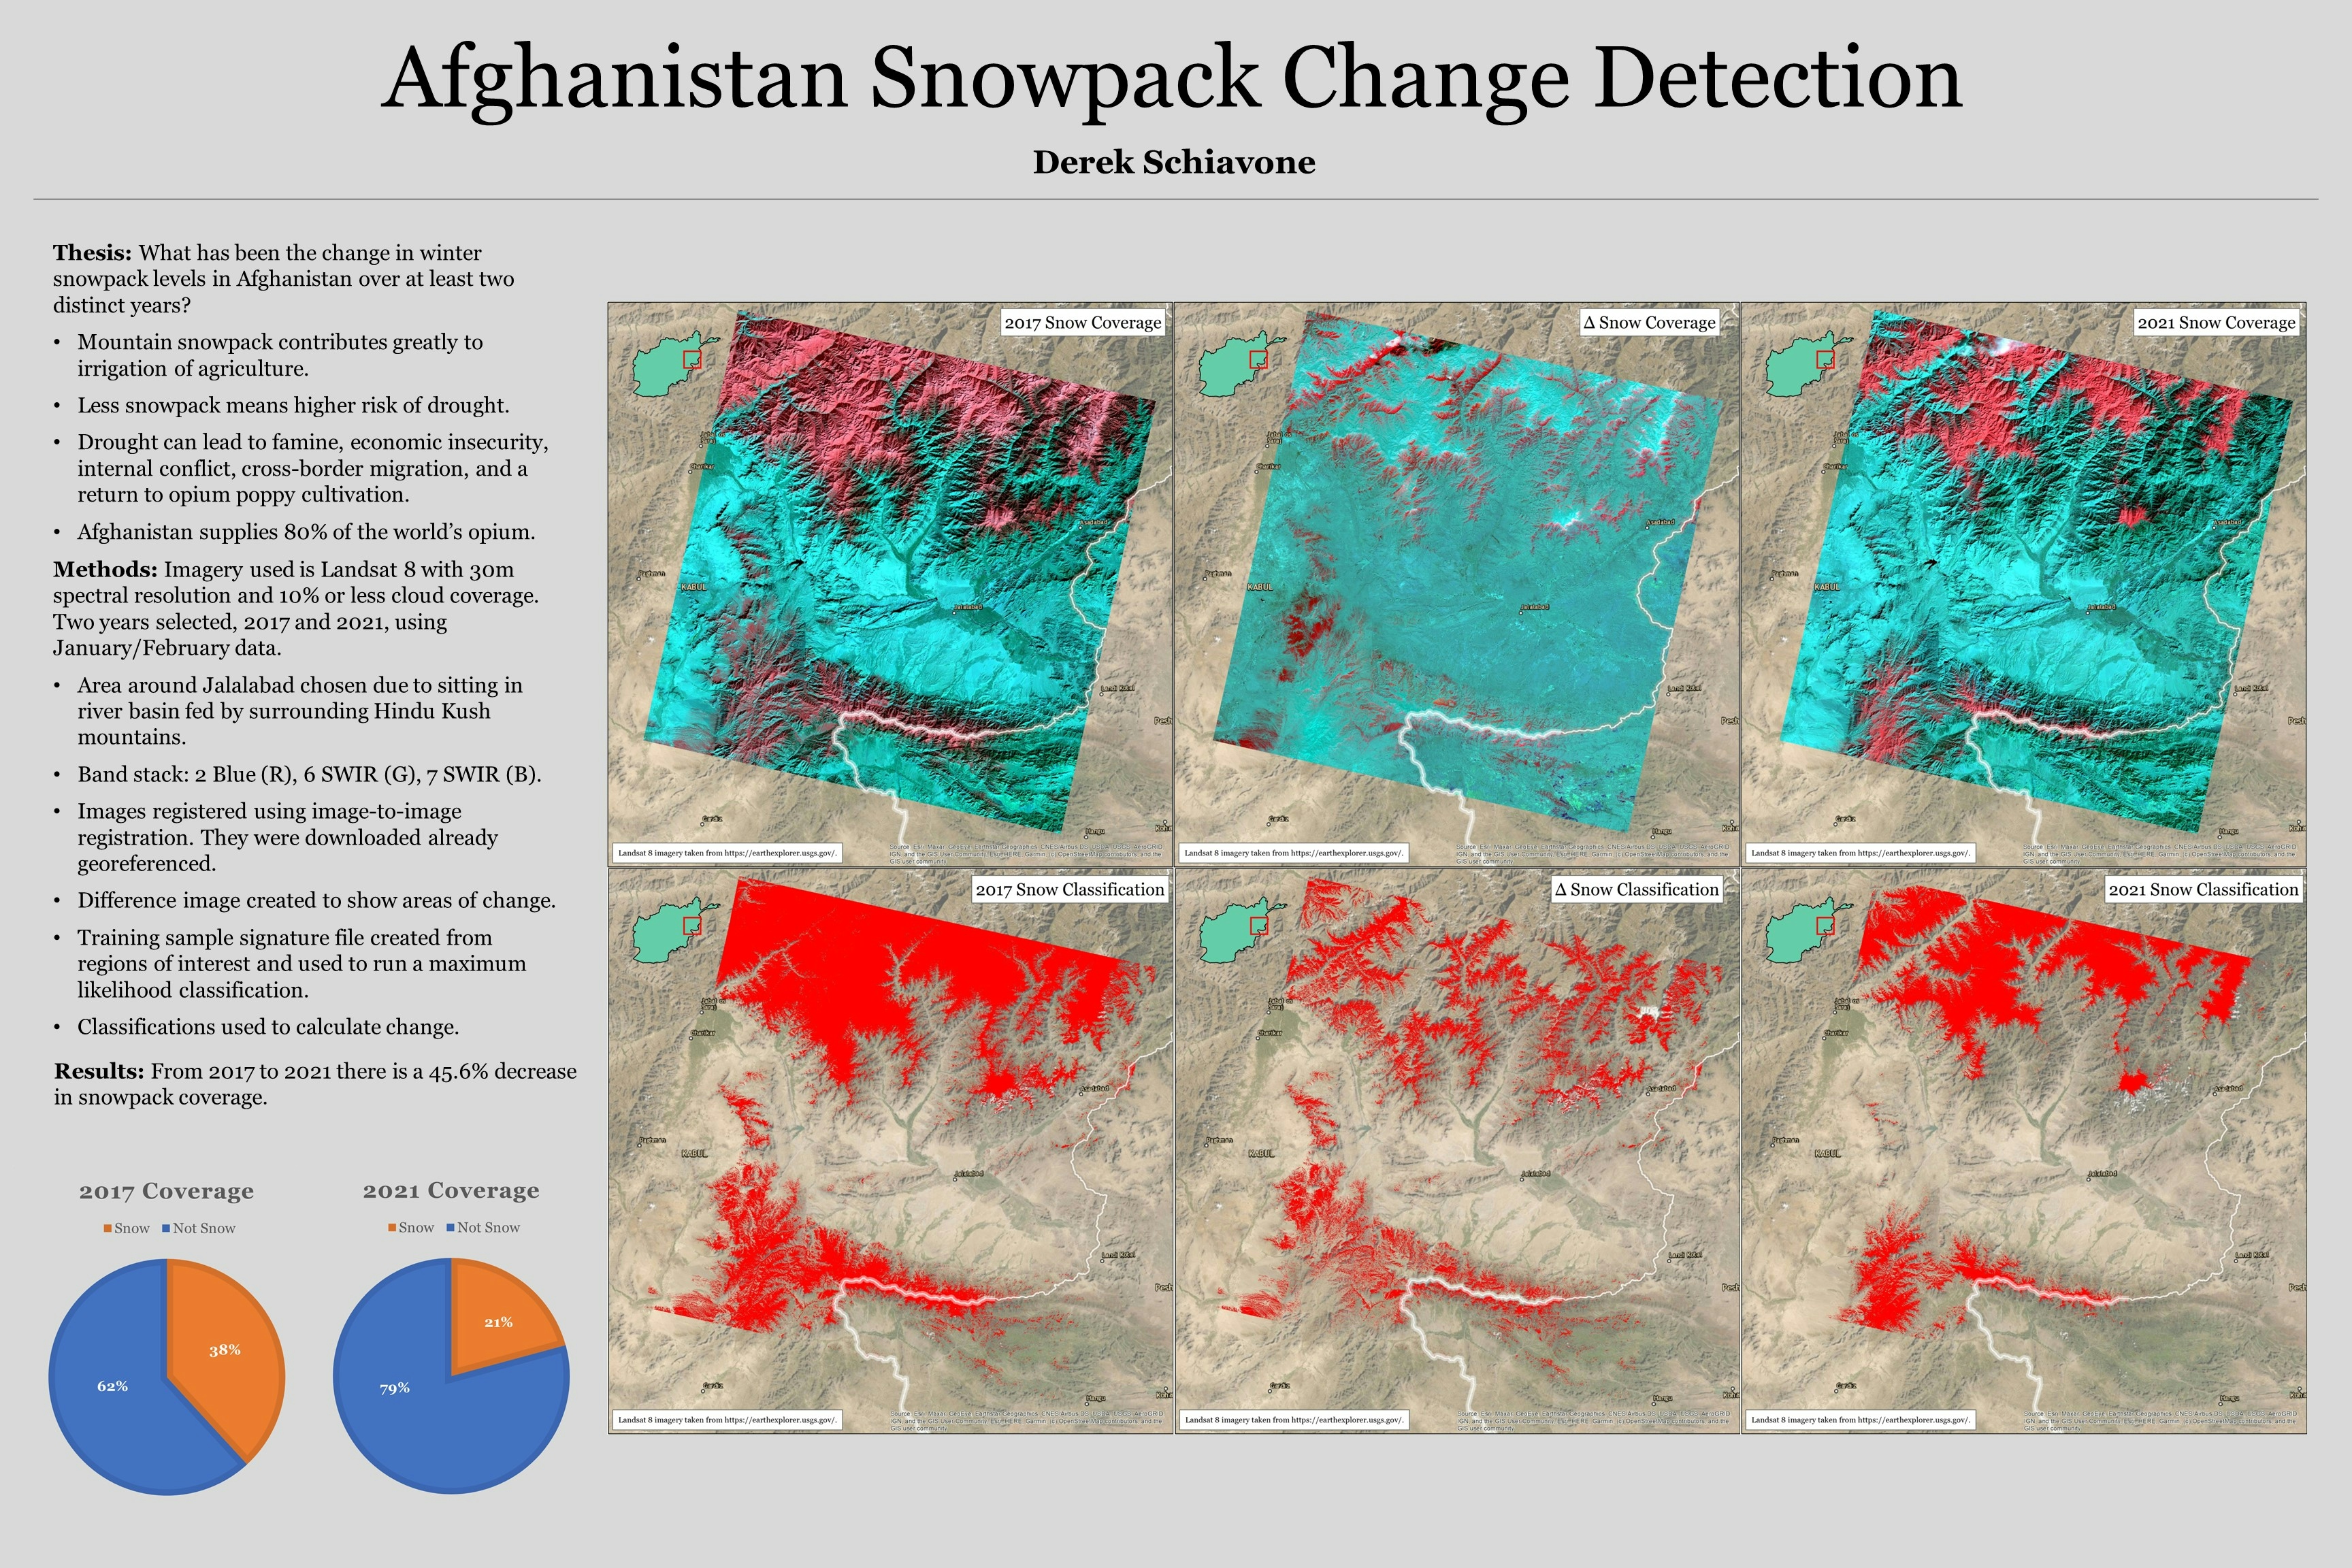
Now armed with multispectral imagery, I had to decide what band combination to create in ESRI ArcMap that would be best suited for identifying snowpack. Creating an image by stacking the Landsat 8 bands 2 (blue), 6 (short-wave infrared), and 7 (short-wave infrared) respectively through the Red, Green, and Blue channels resulted in the snow giving off a red appearance contrasted against a green color for all else. Distinguishing between snow and clouds was not needed as the image data was set to contain 10% or less cloud coverage. Once I had my three-band raster images created for both years (Figures 1, 2) I conducted an image-to-image registration to ensure that the analysis would be accurate and consistent. The Landsat 8 data was already georeferenced to WGS 1984 UTM Zone 42N upon download, so no further processing between the images was needed to begin the analysis.
To classify the images, I used regions of interest to designate Snow and NotSnow areas, creating a training sample signature file in preparation for supervised object-based classification. The signature file was in turn fed into the software when creating the classification raster images for each year (Figures 3, 4) using the maximum likelihood classification method. Inspecting the tables I was able to glean that the year 2021 had substantially less snowpack than 2017. Next, I created a difference image using the two false-color images to be able to see any gain or loss of snowpack (Figure 5). Another classification raster image was created using raster map algebra, subtracting the 2021 classified raster image from the 2017 classified raster image (Figure 6). The three classified raster images were then reclassified to only include the Snow classification and not the NotSnow classification, as it was redundant and would map better without it.
Results & Conclusion
Ultimately, the region analyzed had lost 45.55% of its 2017 snow coverage going into 2021. Snow coverage accounted for 38% of the 2017 land area (Figure 7), while the same land area in 2021 saw only 21% snow coverage (Figure 8). This decrease may be directly related to climate change and may have several secondary and tertiary effects on the socioeconomic situation of the Afghans that live in the Jalalabad region. Moreover, this research may be indicative of the snowpack health in the country overall; adverse effects may be exacerbated in other geographically similar regions.
References
Biemans, H., Siderius, C., Lutz, A. F., Nepal, S., Ahmad, B., Hassan, T., . . . Immerzeel, W. W. (2019). Importance of snow and glacier meltwater for agriculture on the Indo-Gangetic Plain. Nature Sustainability 2, 594–601.
National Intellience Council. (2021). National Intelligence Estimate. Climate Change and International Responses Increasing Challenges to US National Security Through 2040. Office of the Director of National Intelligence.
United Nations Environment Programme. (2016). Climate Change in Afghanistan. What does it mean for rural livelihoods and food security? United Nations.
United Nations Office on Drugs and Crime. (2019). Afghanistan opium survey 2019. Socio-economic survey report: Drivers, causes and consequences of opium poppy cultivation. United Nations.
United Nations Office on Drugs and Crime. (2021). World Drug Report 2021. United Nations.


_2566566.png&w=3840&q=100)
_6354793.jpg&w=48&q=40 "Mohammad Farhan Fadillah")