Introduction
The purpose of this paper is to answer the question: Which Conservation Focus Areas (CFA) contain West Virginia Northern Flying Squirrel (WVNFS) habitats that are in landslide hazard risk areas? Since 2015 West Virginia has instituted a State Wildlife Action Plan (SWAP) that includes “[h]alt the decline of at-risk species and thus avoid the need for federal listing as threatened or endangered” as one of its 10-year goals (West Virginia, 2015, p. 1). SWAP acknowledges that the WCNFS had come off the federal endangered list but is still a US Forest Service’s Regional Forester’s Sensitive Species for the Monongahela National Forest as well as one of West Virginia’s 600 “Species of Greatest Conservation Need” (SGCN) (p. 61). Of the 21 major stressors identified in SWAP for terrestrial SGCN’s, landslides are not one of them. Yet, SWAP states that Red Spruce/Northern Hardwood Forest recovery may be impeded by climate change, which it also identifies as the habitat for the WVNFS. SWAP goes so far as to tie the survival of the WVNFS directly to West Virginia’s Red Spruce Forests (pp. 58-61).
Intense weather events associated with climate change such as temperature rise, extreme rainfall, and hurricanes, can all lead to increased landslide activity (Palmer, 2020). In turn, landslides can have a devastating effect on forested areas to include widespread stripping and a decades-long revegetation timeline (Schuster & Highland, n.d.). Furthermore, the US Federal Emergency Management Agency (FEMA) National Risk Index (NRI) identifies 47 of 55 counties in West Virginia as “Relatively Moderate” or higher risk for landslides (FEMA, 2021). Therefore, although landslides are not specifically identified by SWAP as a major stressor for terrestrial SCGNs, they may become a more prominent threat to WVNFS habitats in the future as the prevalence of climate change worsens the state’s risk of this type of natural hazard.
To institute the SWAP, several Conservation Focus Areas were created across the state based on HUC-12 watersheds and shared geographical contexts of natural habitat distribution, biogeography, and effects of land use (West Virginia, 2015, p. 282). CFAs cover nearly half of West Virginia and vary in terms of land ownership. Since it is West Virginia’s intent to implement conservation efforts at the CFA level, the landslide risk of WVNFS habitats will be referenced within the context of these areas. Alongside this, I will present tables that depict the amount of acreage within each CFA for each level of landslide risk.
Methods
Various types of data were used for this analysis. Elevation, land cover, state-level landslide risk index, and CFA boundaries were all sourced from the West Virginia GIS Technical Center (West Virginia, 2021). The landslide data was one of the layers in the National Pipeline Hazard Index using a scale of 0-100, where 100 represents the highest ground failure hazard and 0 the lowest. Beyond this there was not much more information to go on, so I decided to supplement this data with FEMA’s NRI data, which itself covers 18 different hazards across every county in the US. The landslide data has five rankings based on the index ratings. Between the two, I would be able to assess landslide risk with more confidence in my analysis.
To begin with, the elevation layer was used in conjunction with the land cover layer to generate a total possible area for the WVNFS habitat. The data frame properties were set before loading data to NAD 1983 UTM Zone 17N, which is most appropriate for West Virginia. The environment settings were also set for 30m cell size since I knew I would be working extensively with rasters. When loading the landcover raster data, it was projected in NAD 1927 so I projected it into the same projection that I set my data frame in, NAD 1983. Being that the WVNFS known habitats are over 909m in elevation (National Resources Conservation Service, n.d.) I reclassified the elevation raster to “1” for all elevation over that number and NoData for all else. Landcover was also classified according to the known forest habitats to include red spruce, fir, beech, yellow birch, sugar or red maple, hemlock, and black cherry (US Fish & Wildlife Service, 2006). Being that there were predetermined classes I chose what was best suitable considering the given tree types: woodland, cove hardwood forest, diverse/mesophytic hardwood forest, hardwood/conifer forest, mountain hardwood forest, mountain hardwood/conifer forest, and mountain conifer forest. This model yielded 1,055,676 acres 0f possible WVNFS habitat.
Next, I worked with the FEMA NRI data. This data was arranged by country and identified 47 counties that had a landslide risk rating of “Relatively Moderate,” “Relatively High,” or “Very High.” Since this data was for all counties in the US, I selected by state attribute and created a West Virginia-specific FEMA NRI layer. With this, I selected by attribute again but this time for the three risk ratings mentioned above, creating yet another layer. This layer I converted into a raster and performed raster map algebra with the classified habitat model to create a raster layer that depicted the three landslide risk ratings of the WVNFS habitat.
For the state-level landslide risk index, I performed a similar process. This raster layer was originally in 1,000m cell size but because of the environment settings I had set earlier, I was able to use it with 30m cell size. I classified the risk index ratings into three groups based on Jenks natural breaks, since there wasn’t much information to parse from the metadata. This I used with the habitat model and performed the raster map algebra, resulting in a new raster of WVNFS habitats depicting three different levels of landslide risk.
At this point, I had two habitat models, each reflecting landslide risk in three tiers, ranked as 1, 2, and 3. I used raster map algebra again on these two habitat risk models, which resulted in a six-tiered risk model with classes of 1, 2, 3, 4, 6, and 9. This was more than needed as I wanted to keep it simple with a three-tiered model., so I reclassified it back down using Moderate risk for class 1, High risk for classes 2 and 4, and Very High risk for classes 3, 6, and 9. This was a conservative classification retaining the highest risk level for any one calculation of map algebra that resulted in the six-tiered classification. For example, 2 x 2 = 4, but this classification is only two High-risk classifications combined and does not have a Very High classification involved, so I ranked it only as High risk. Whereas the 1 x 3 = 3, which I classified as Very High since the calculation incorporated a Very High classification.
This final landslide risk habitat model was reclassified yet again, but only to parse the individual risk ratings from each other into their own raster layers. These individual risk raster layers were each used to perform zonal table statistics in conjunction with the CFA layer, producing Moderate, High, and Very High summations of square kilometers for each CFA. For each zonal statistics table, this was recomputed into acres and exported as an excel document. Maps were then created for the CFA polygon areas as references with numbers all overlayed and transparent over the elevation raster to depict CFA geographic variation. The second map is built slightly off of the first one, with CFA area colors more subdued to highlight the three-tiered landslide risk habitat model overlayed on top. Considering that the latter is exactly the final product I sought after, and in conjunction with the exported tables conveys the appropriate information needed to answer the main question, more maps were not needed.
Results & Conclusion
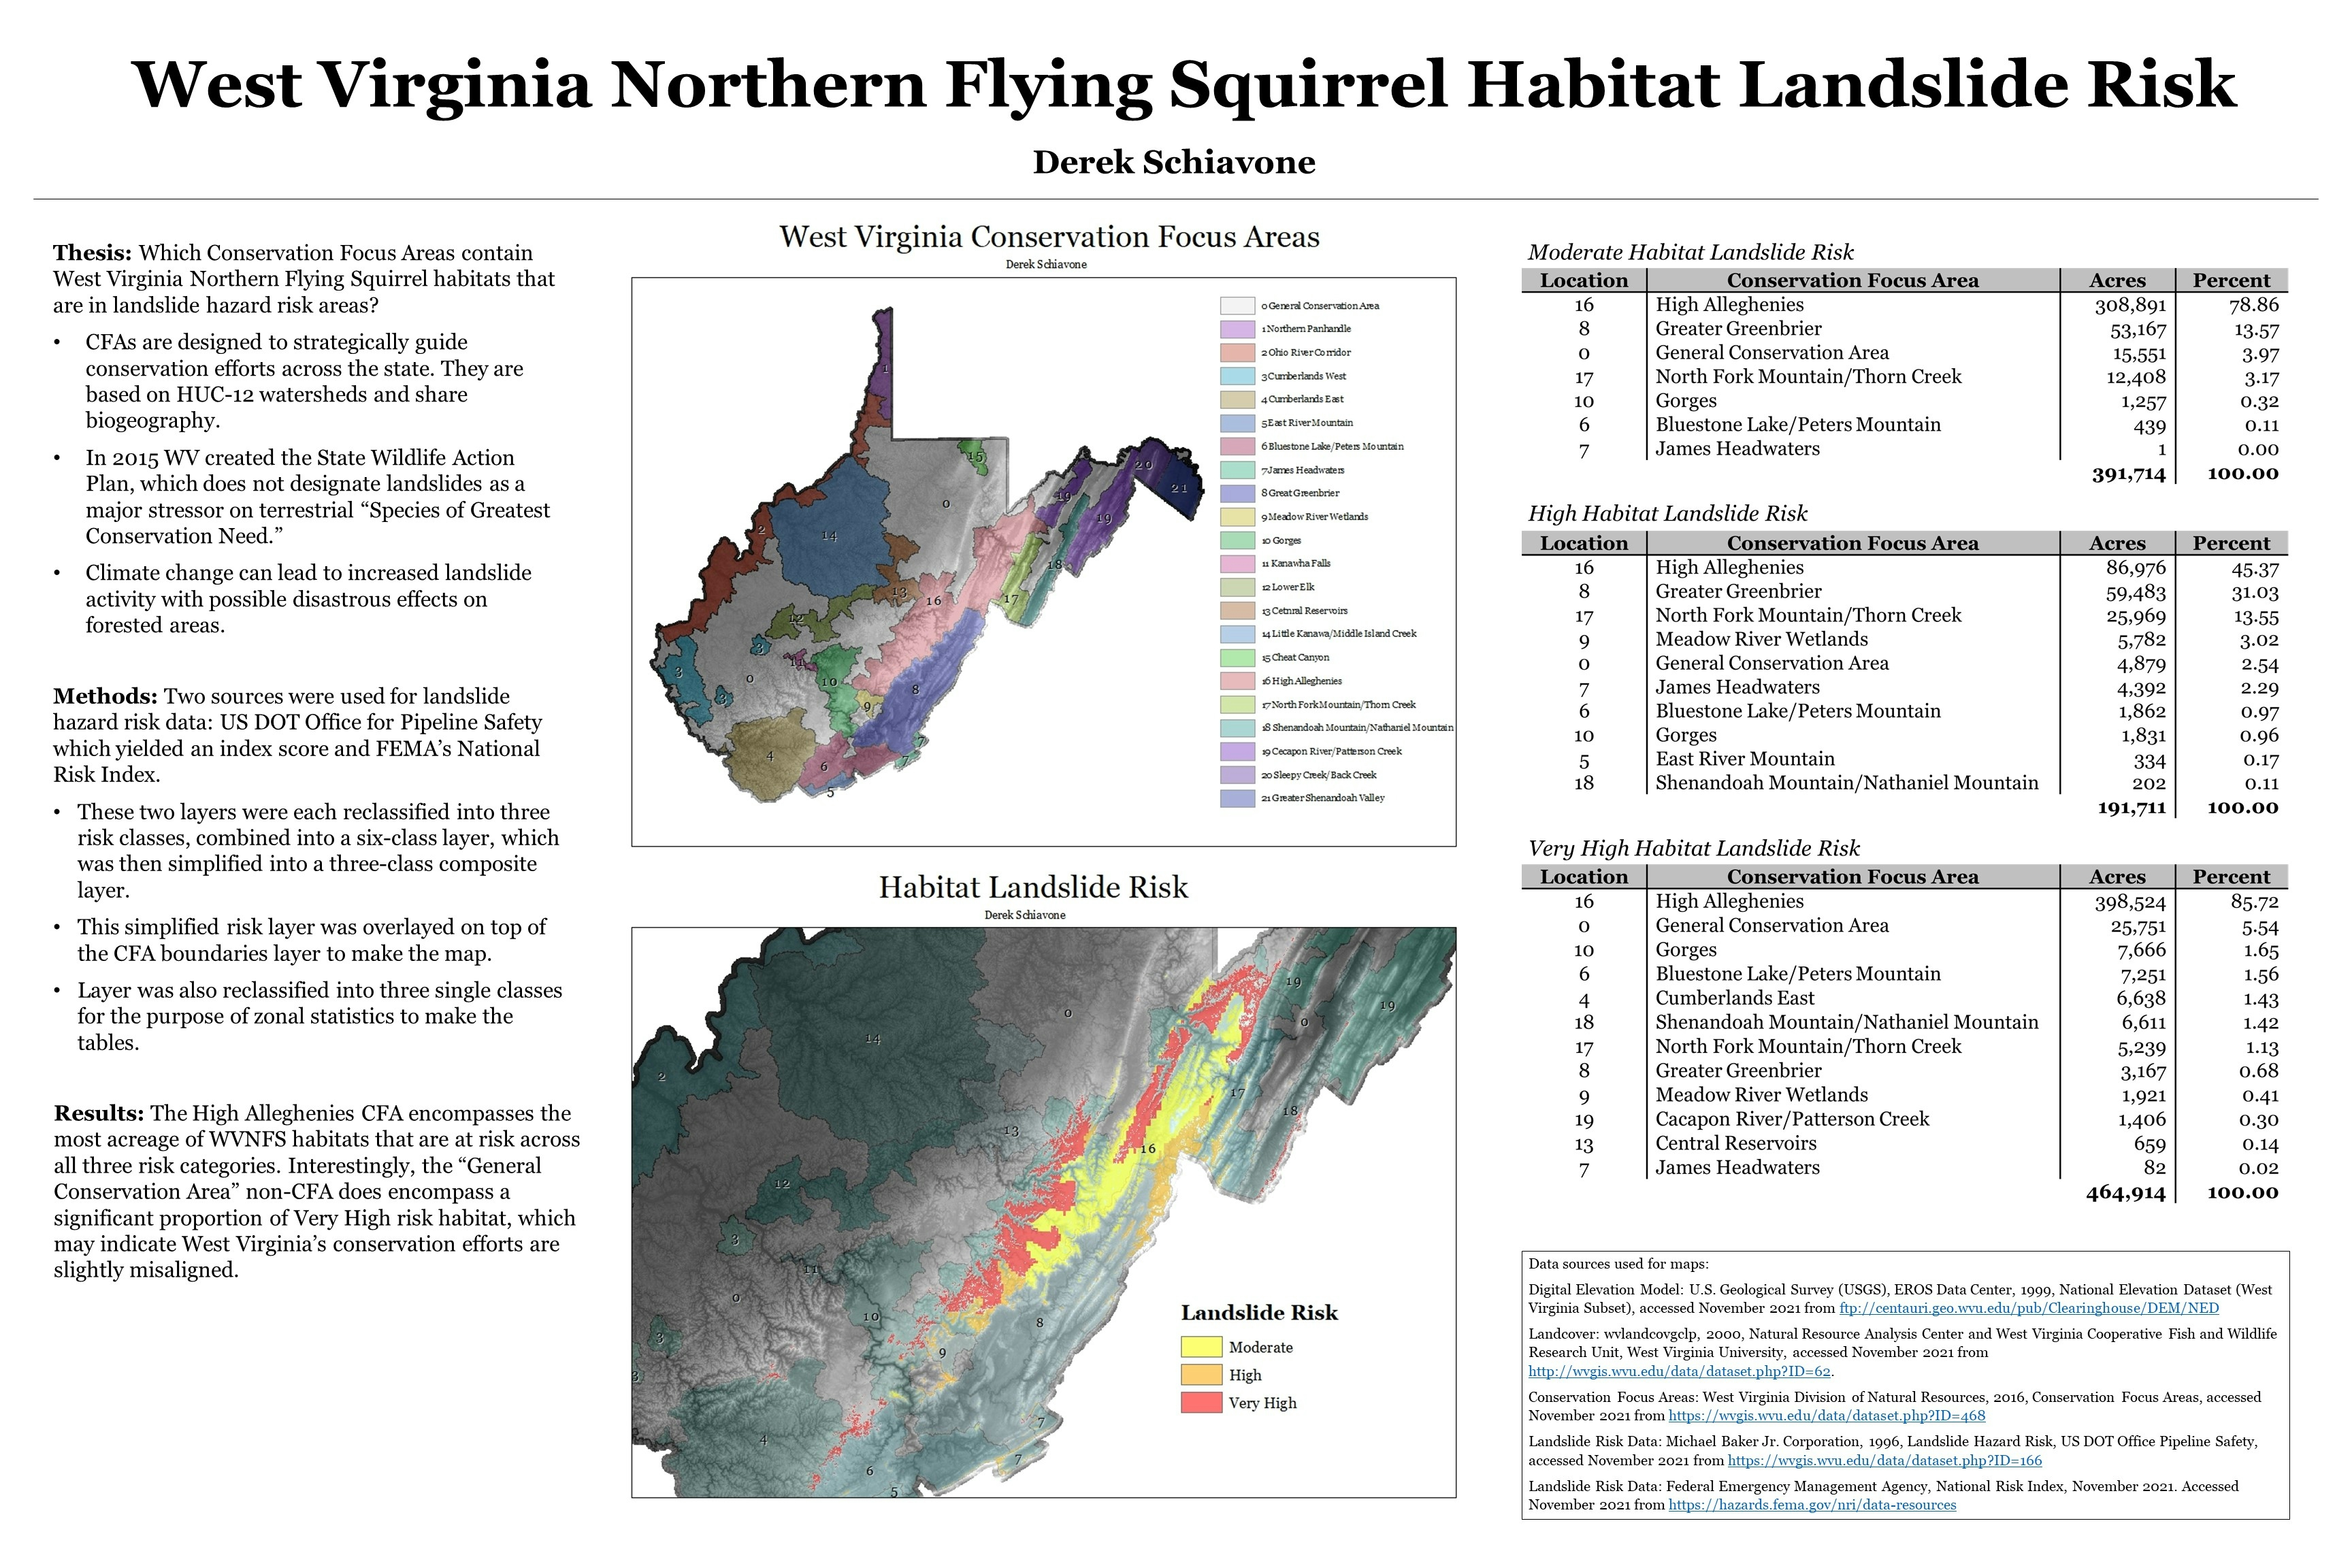
The first map, which is needed for reference, is the Conservation Focus Areas of West Virginia (Figure 1). Since writing out the entire names of each CFA on the map cluttered it and made it difficult to interpret, I used the numbers assigned to the CFAs in SWAP on the map and referenced those in the legend to each CFA. These areas are highly irregular in shape and size, sometimes being split into two distinct polygons, so it is important to be able to visualize the CFAs geographically. The second map (Figure 2) is the full Habitat Landslide Risk, classified into three tiers of risk and overlayed on top of a subdued CFA layer to help accentuate the habitats. The three tables (Tables 1, 2, 3) identify the CFAs by raw acreage and acreage percentage of habitat for each risk level, resulting in one CFA ranking highest across all three categories: High Alleghenies. This CFA holds 85.7% of Very High-risk habitats, 78.9% of High-risk habitats, and 45.4% of Moderate risk habitats. Interestingly for the Very High risk rating, the second highest area by acreage was “General Conservation Area” at about 5.5% which is the baseline conservation area nomenclature used for areas not designated specifically. This may indicate that West Virginia’s conservation efforts are slightly misaligned.
References
Federal Emergency Management Agency. (2021). National Risk Index. Retrieved from FEMA: https://hazards.fema.gov/nri/map, verified 26 November 2021
Natural Resources Conservation Service. (n.d.). West Virginia Northern Flying Squirrel. Natural Resources Conservation Service.
Palmer, J. (2020, November 23). A Slippery Slope: Could Climate Change Lead to More Landslides? Retrieved from Eos: https://eos.org/features/a-slippery-slope-could-climate-change-lead-to-more-landslides verified 26 November 2021
Schuster, R. L., & Highland, L. M. (n.d.). Impact of Landslides and Innovative Landslide-Mitigation Measures on the Natural Environment. Denver: U.S. Geological Survey.
US Fish & Wildlife Service. (2006). West Virginia nothern flying squirrel. US Fish & Wildlife Service.
West Virginia. (2015). 2015 West Virginia State Wildlife Action Plan. West Virginia Division of Natural Resources.
West Virginia. (2021, November). West Virginia GIS Technical Center. Retrieved from West Virginia GIS Technical Center: http://wvgis.wvu.edu/index.php verified 26 November 2021


.png&w=3840&q=100)
 He")