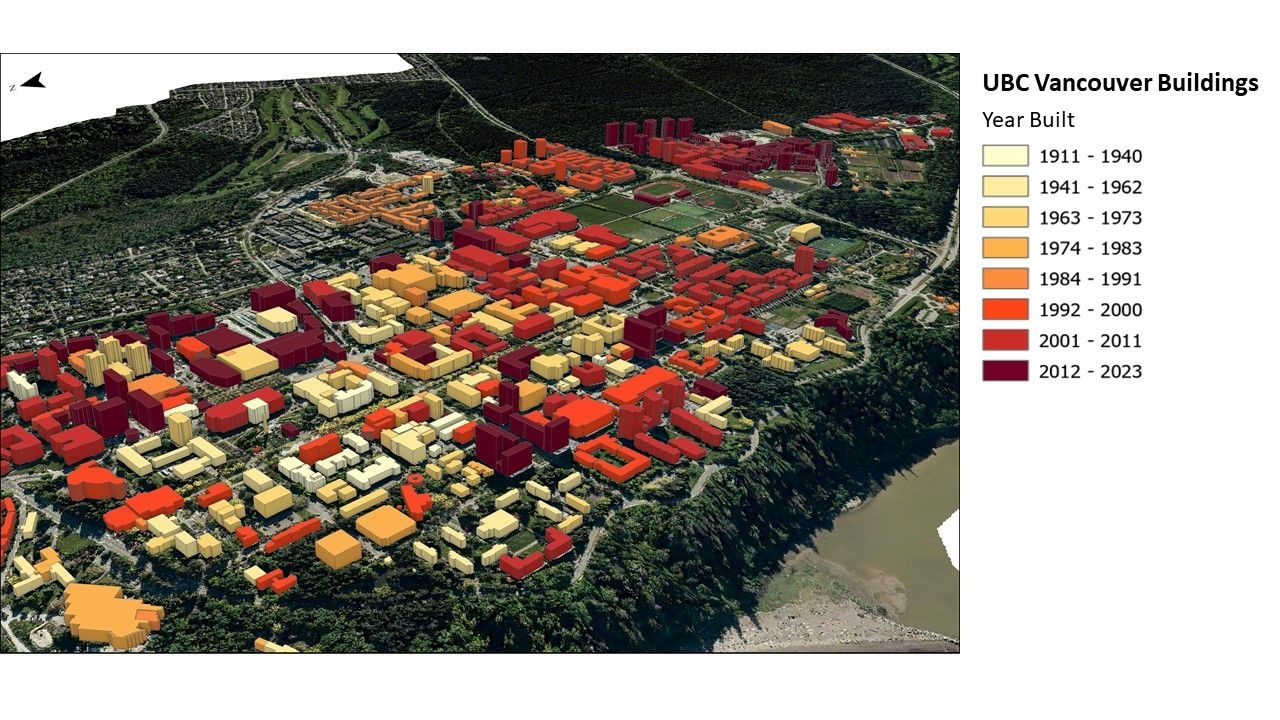

The maps show a temporal visualization of the timeline of UBC's Buildings.
I created these using ArcGIS Pro. By integrating detailed building layrs and height data, I created a 3-D scene with Height-based extrusions. Complementing this, I utilized a Digital Elevation Model (DEM) and orthophoto as a base layer.
I utilized time as a variable and designed the time slider usingYear creation data from Campus and Community Planning records. I refined the symbology to distinctly represent different time periods. The output was exported as a Webscene, where settings were optimized. Then, I used the ArcGIS Instant App to provide access to the users.
Kindly use the cursor to slide the timeslider and view changes along the timeline.
Note: Access to ArcGIS online may be required to view the project. Also, the web application currently presents some limitations in terms of its functionality. The symbology created in ArcGIS Pro can not be translated online and the play button on the slider doesn't show the buildings cumulatively over the entire time period. Hence, I request you to use the cursor to scroll across the slider.


.svg "Alec Soltes")