

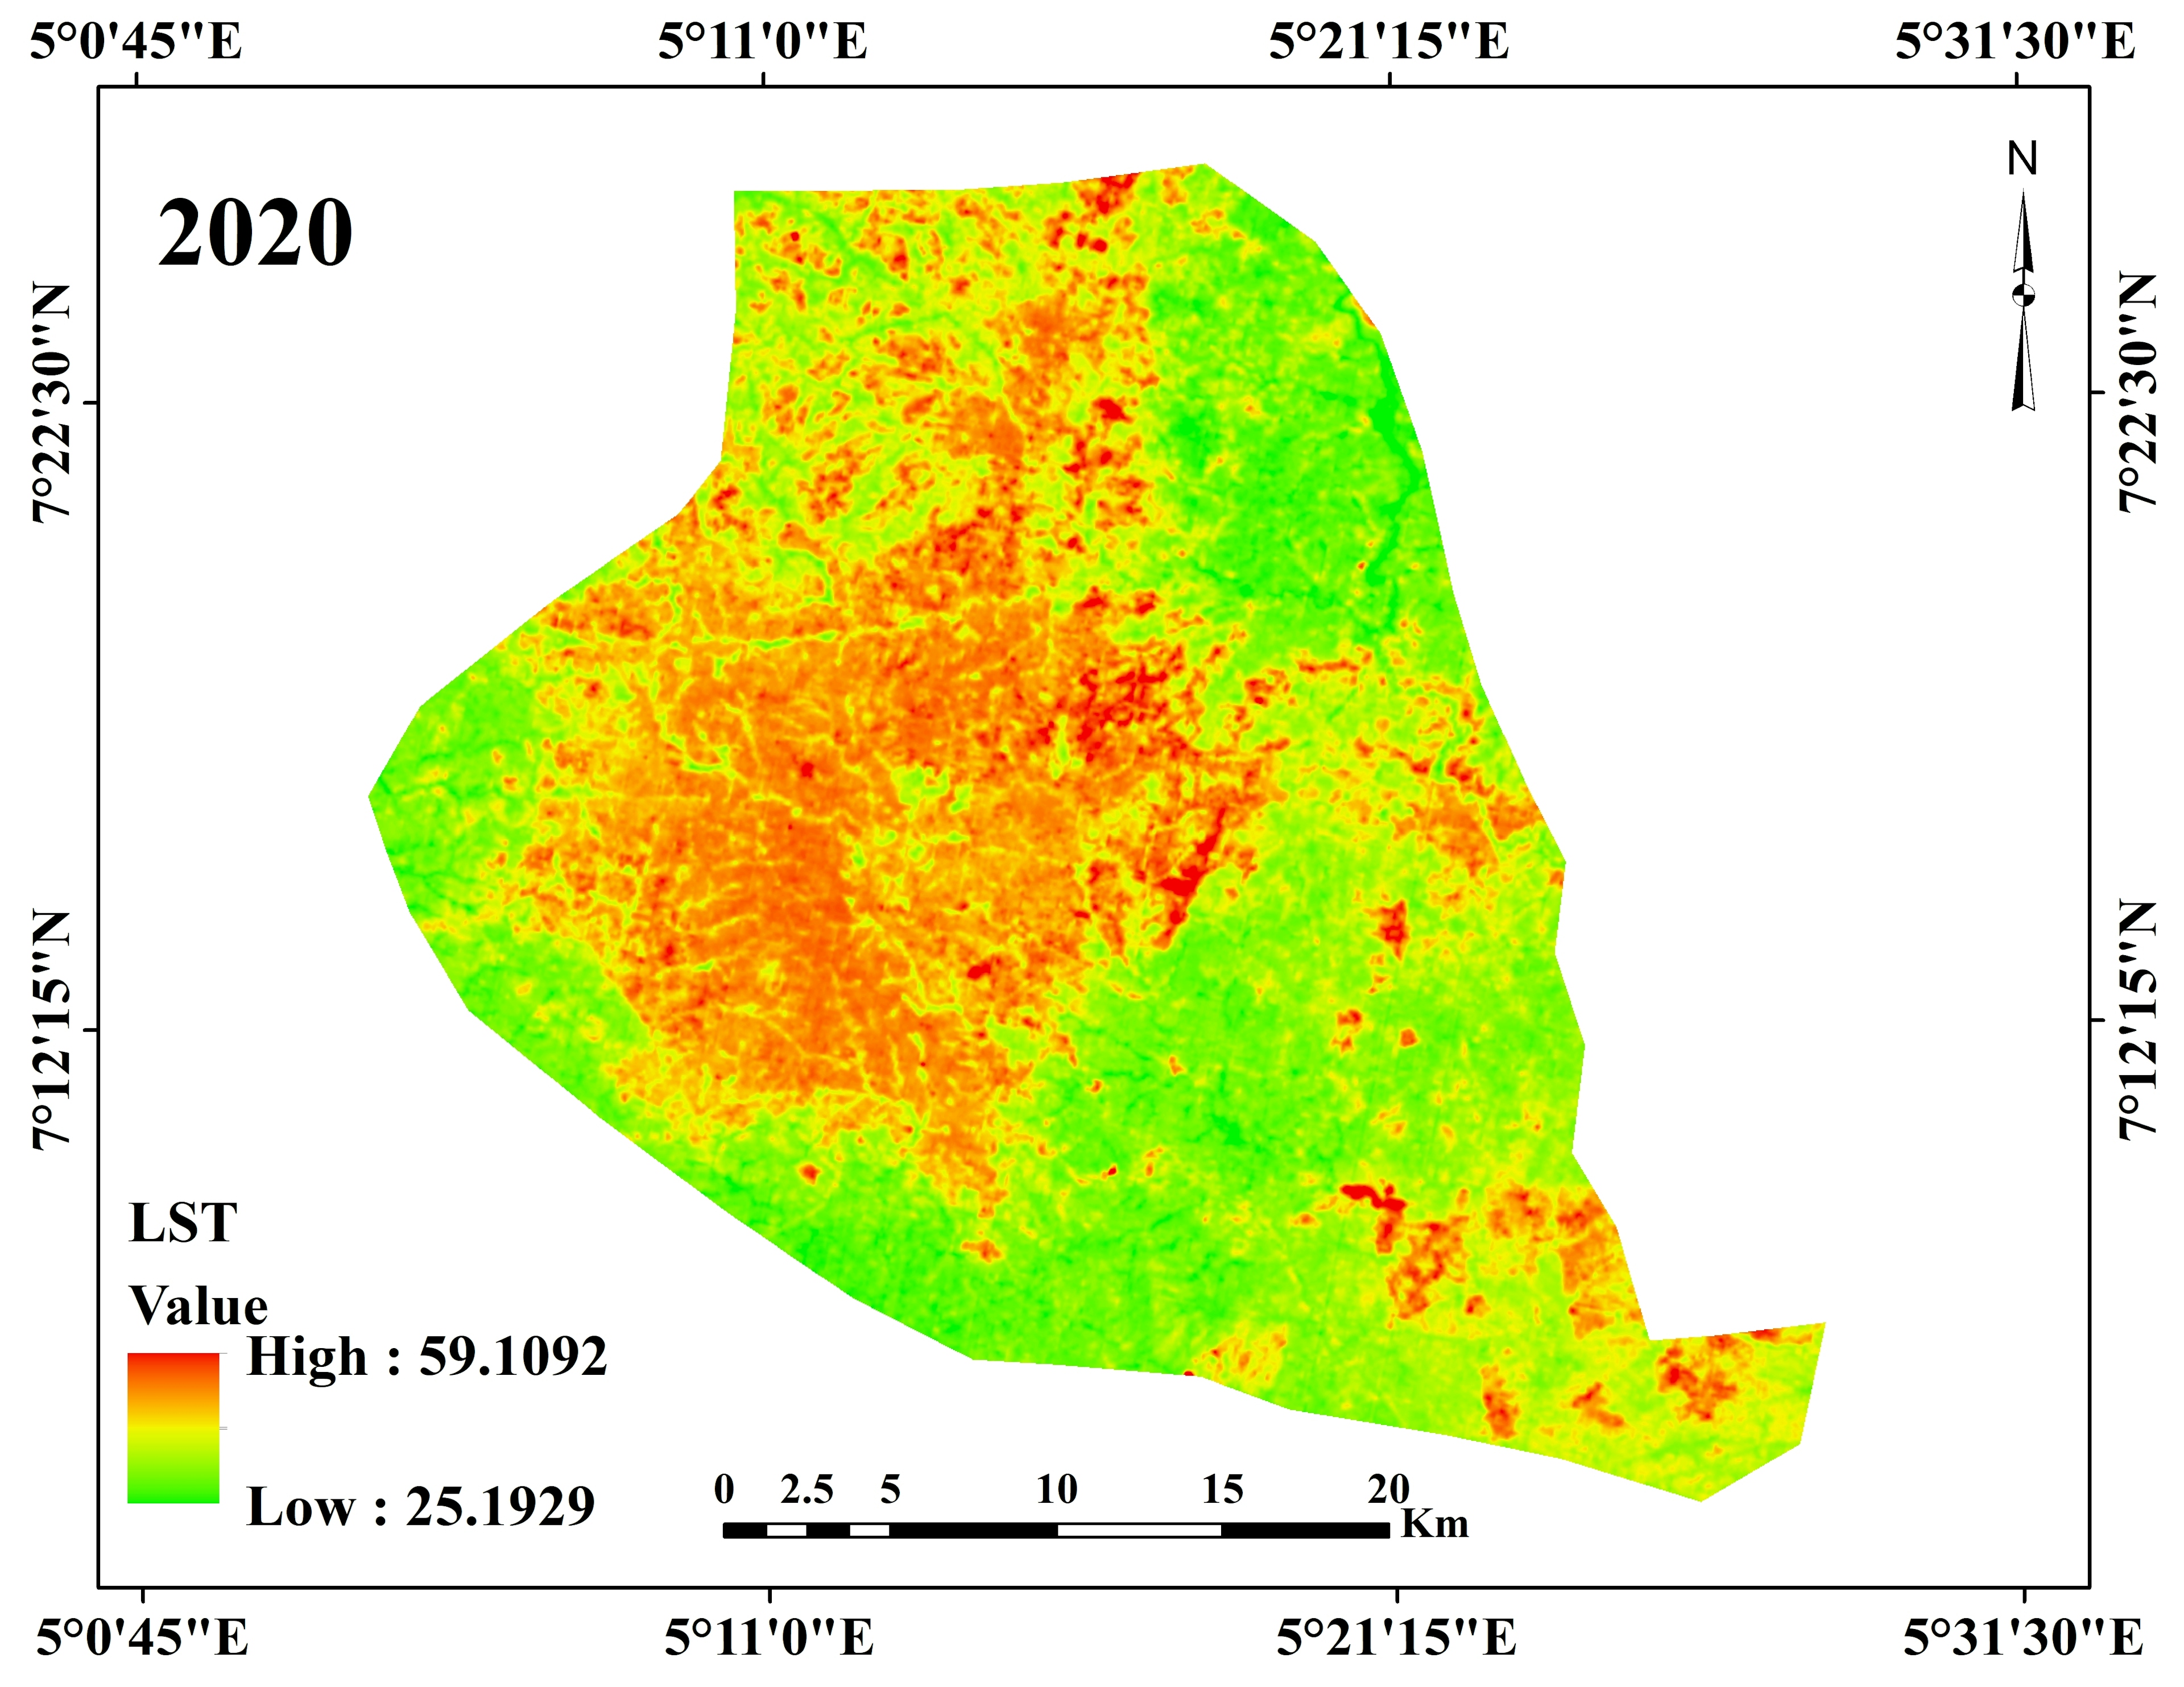
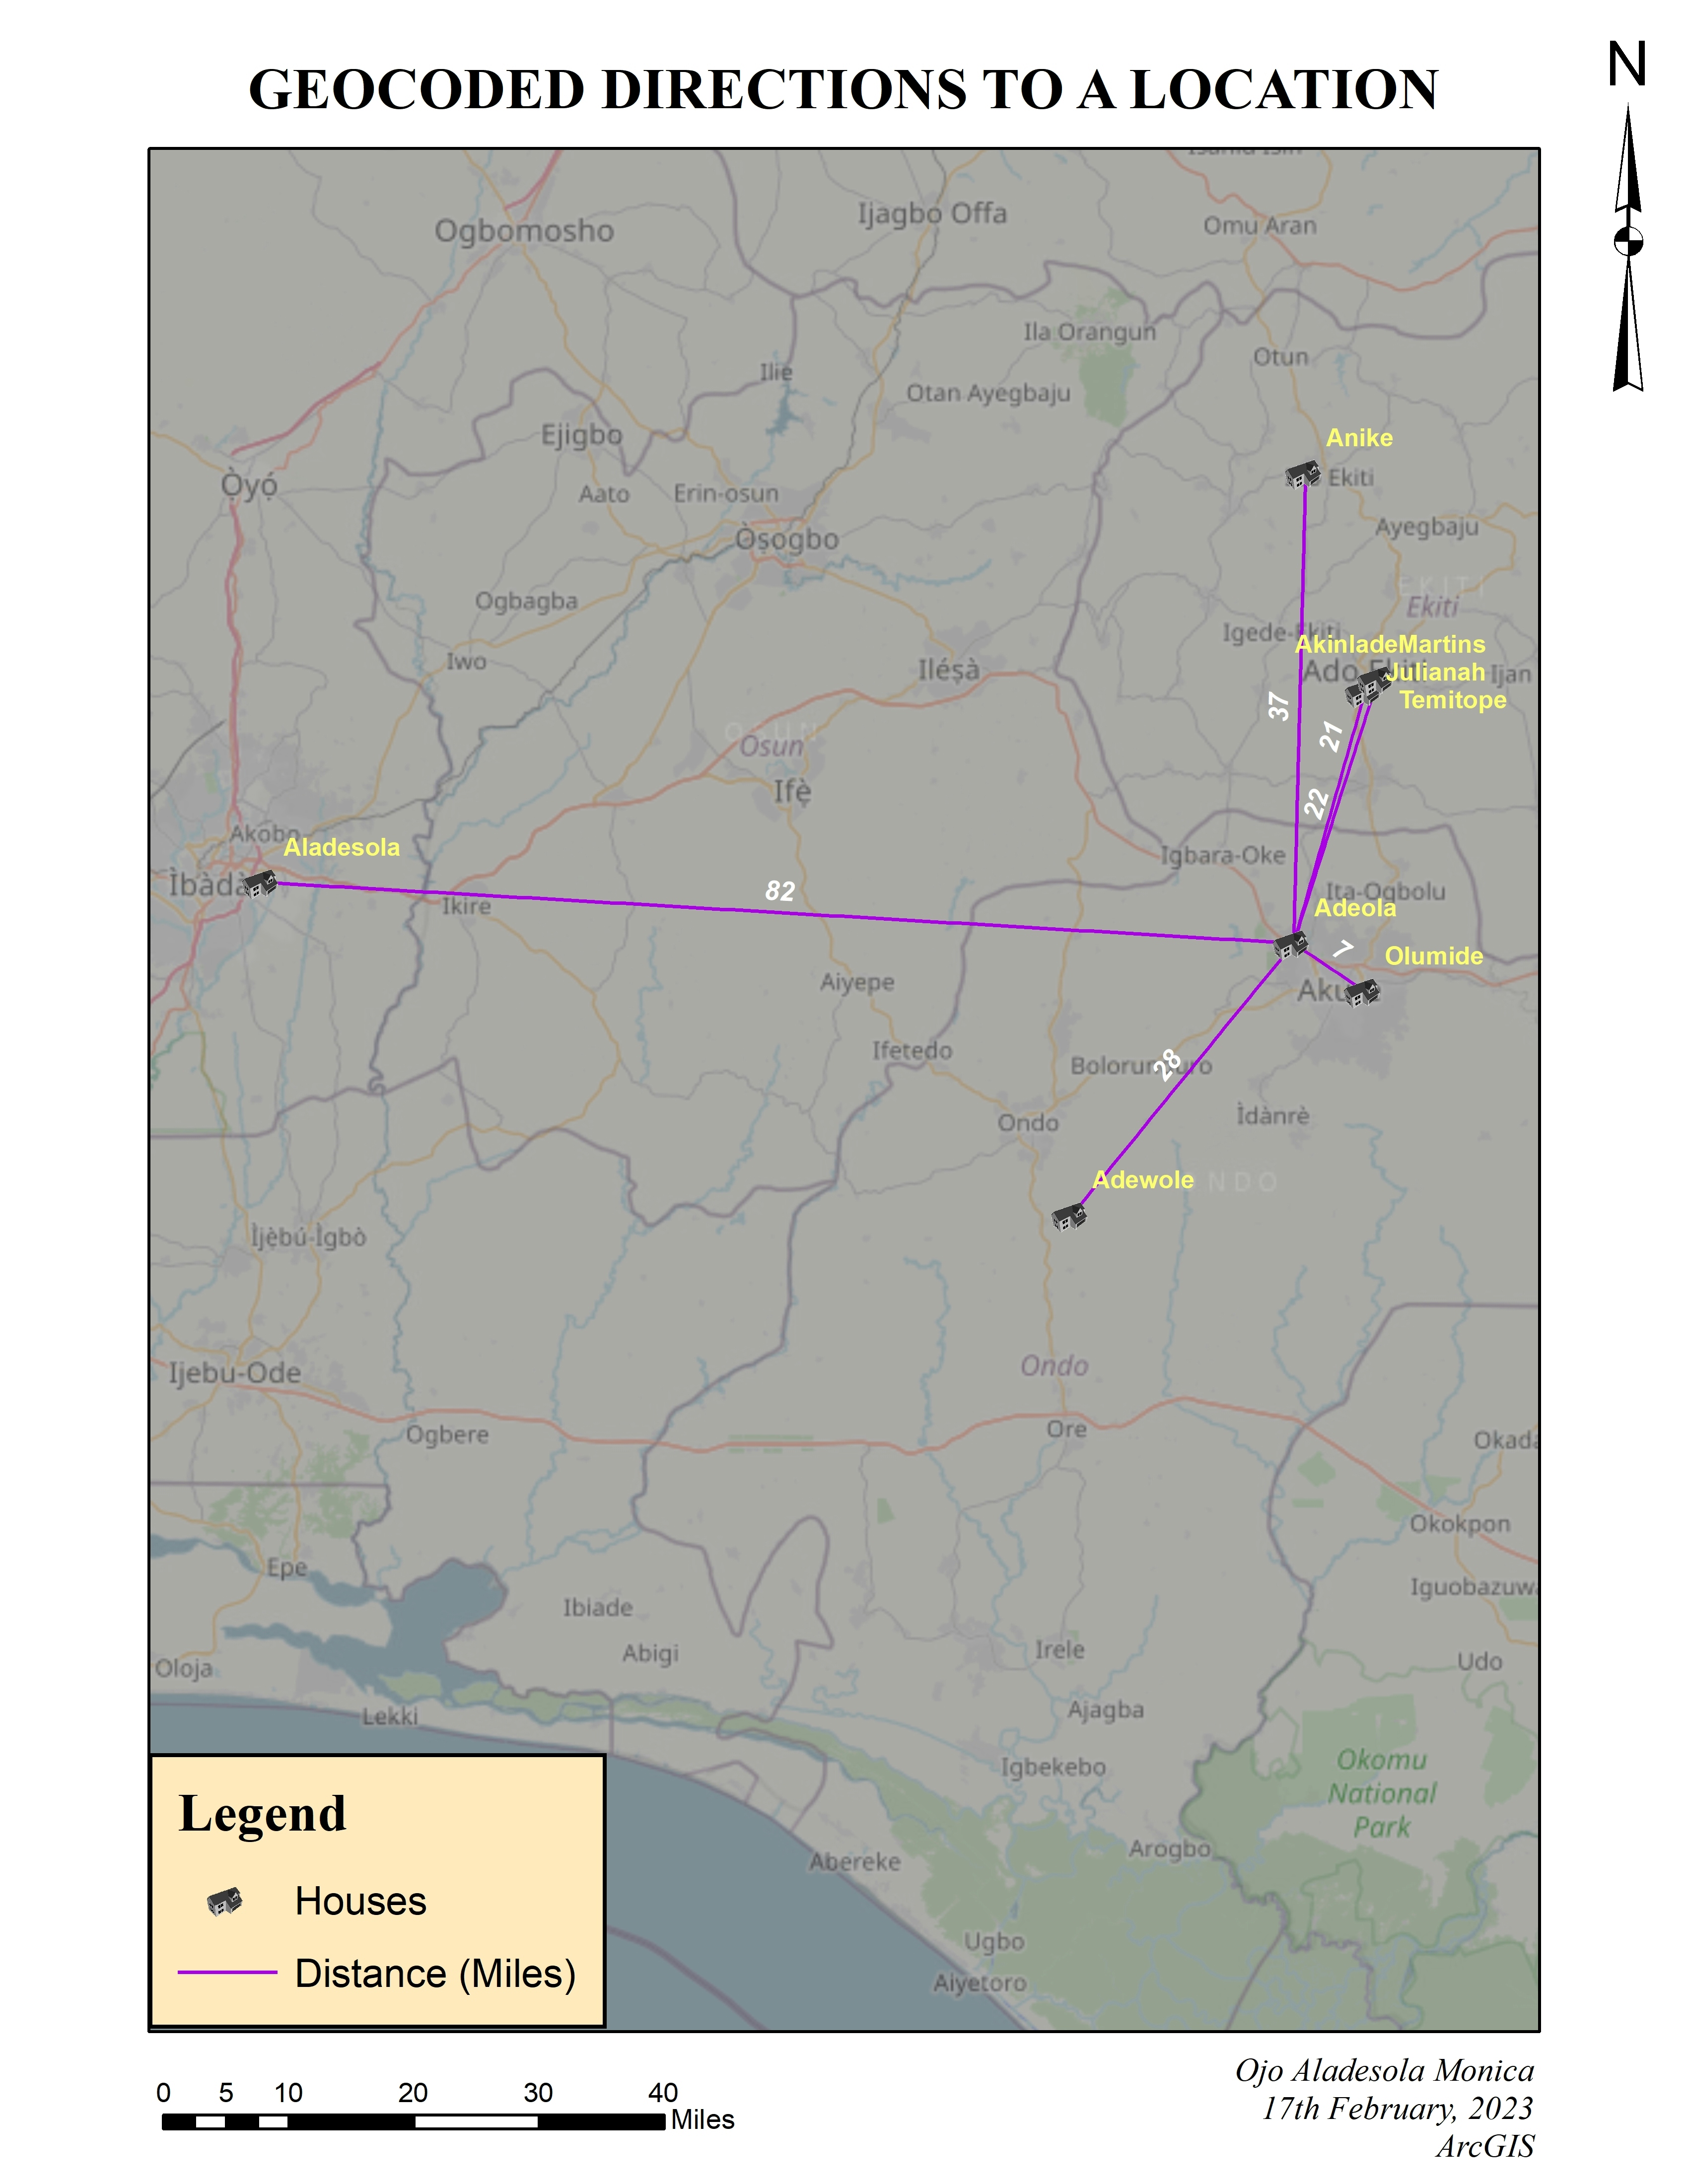
Landsat imageries were used in the production of this map. ArcGIS software was used in extracting the study area while Remote Sensing techniques were used applied for the image processing. The image shows a significant increase in temperature by 2020 compared to 1984, which may be due to the decrease in vegetation and increase in infrastructural developments.
Akure Temperature Map (1984 and 2020)
Tools used
ArcGISGoogle Earth Engine(GEE)Remote SensingSpatial analystUSGS Earth Explorer
Plug-ins used
ArcMapLandsat 8Layout ExportSpatial Analyst Toolbox
tags
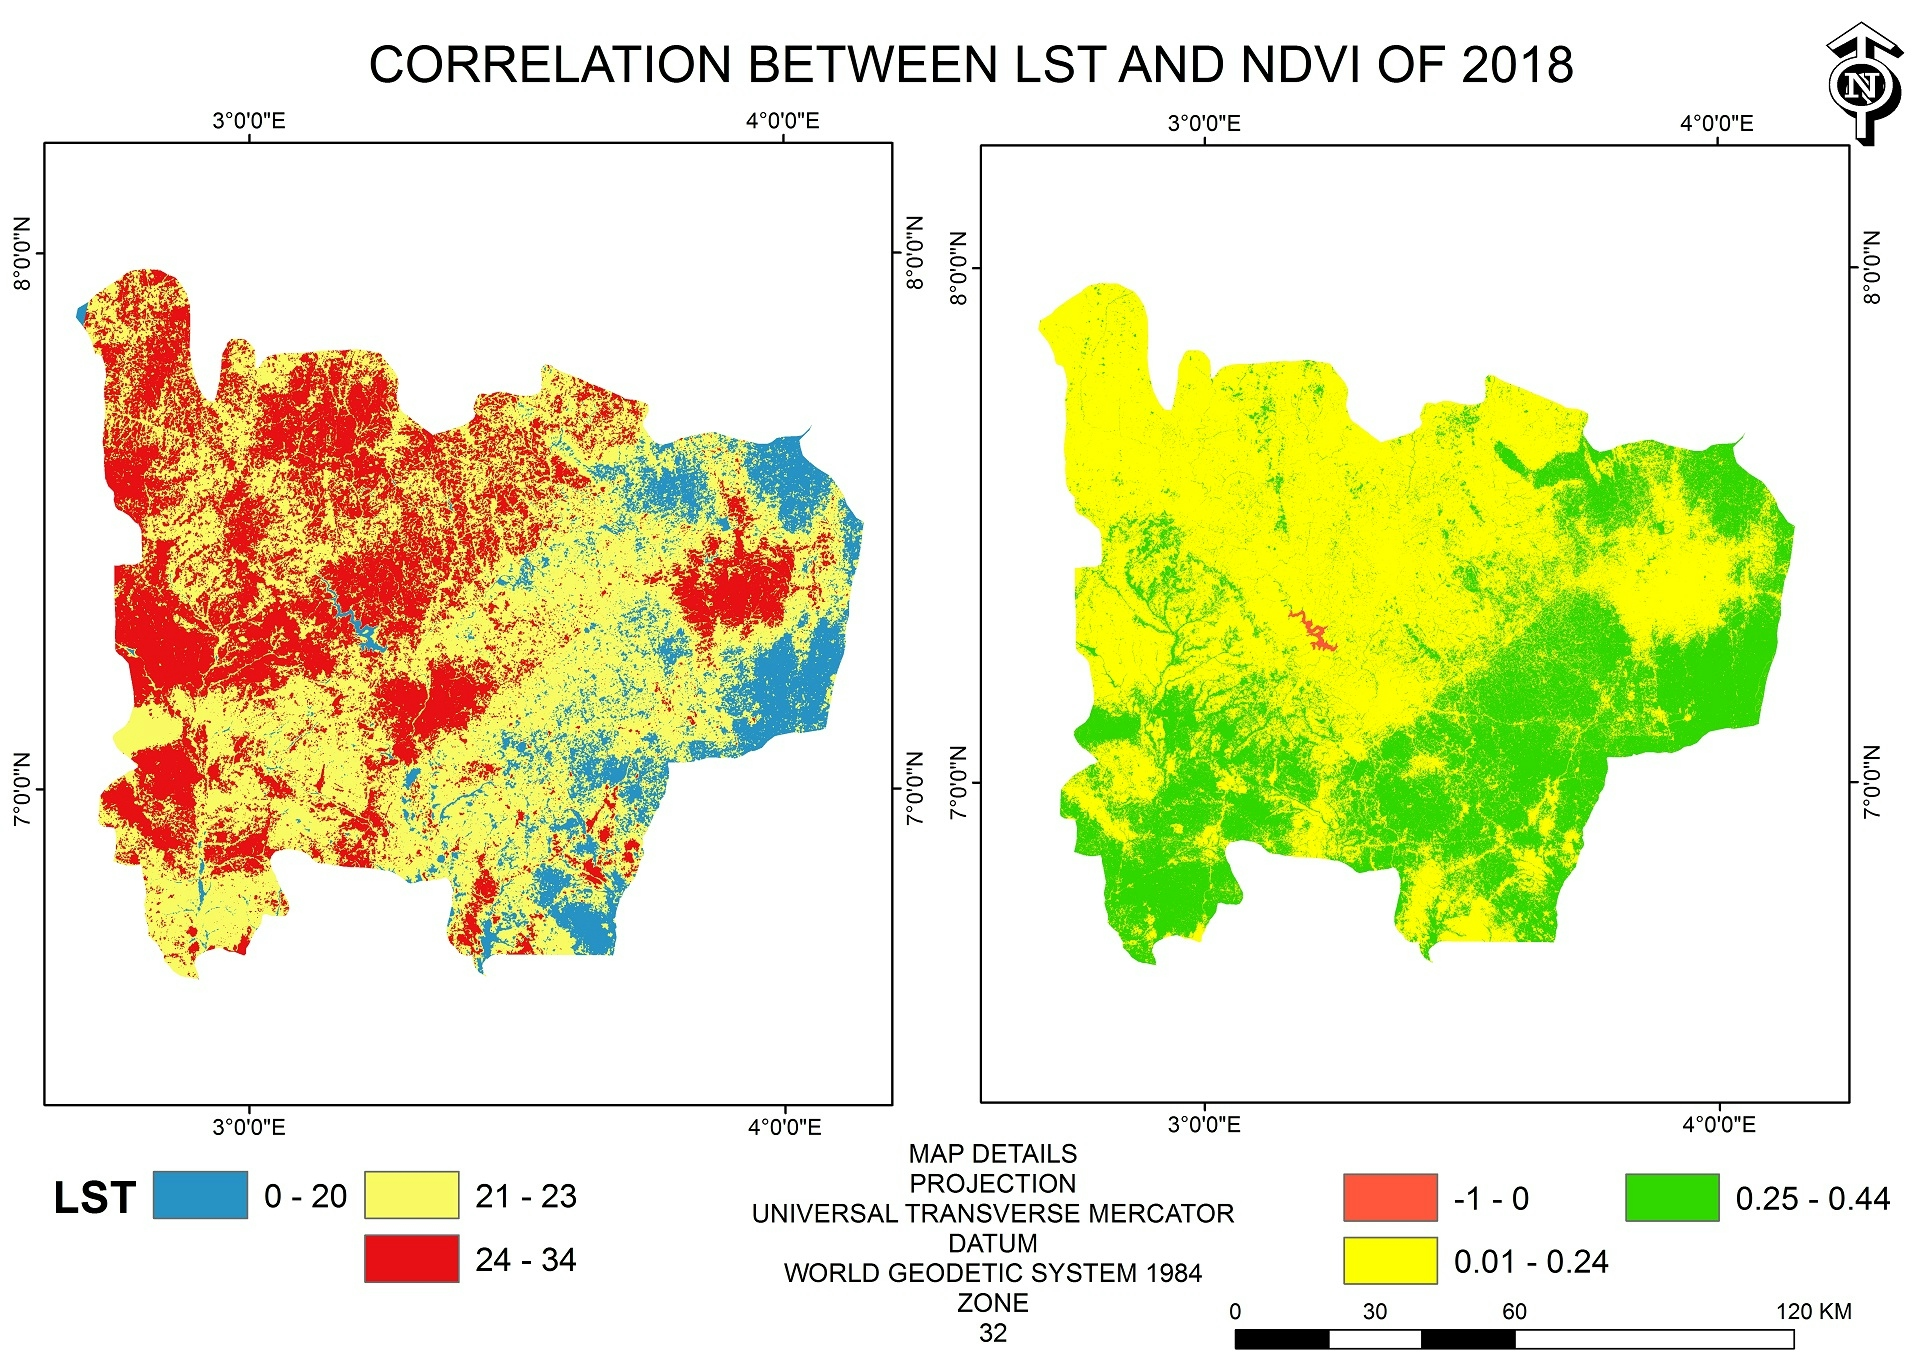
ArcGISLand surface temperatureNDVI
More by Ojo Aladesola Monica

You might also like

.svg "Keran Nkongolo")


_1708284.png&w=3840&q=100)


Join the community!
We're a place where geospatial professionals showcase their works and discover opportunities.