
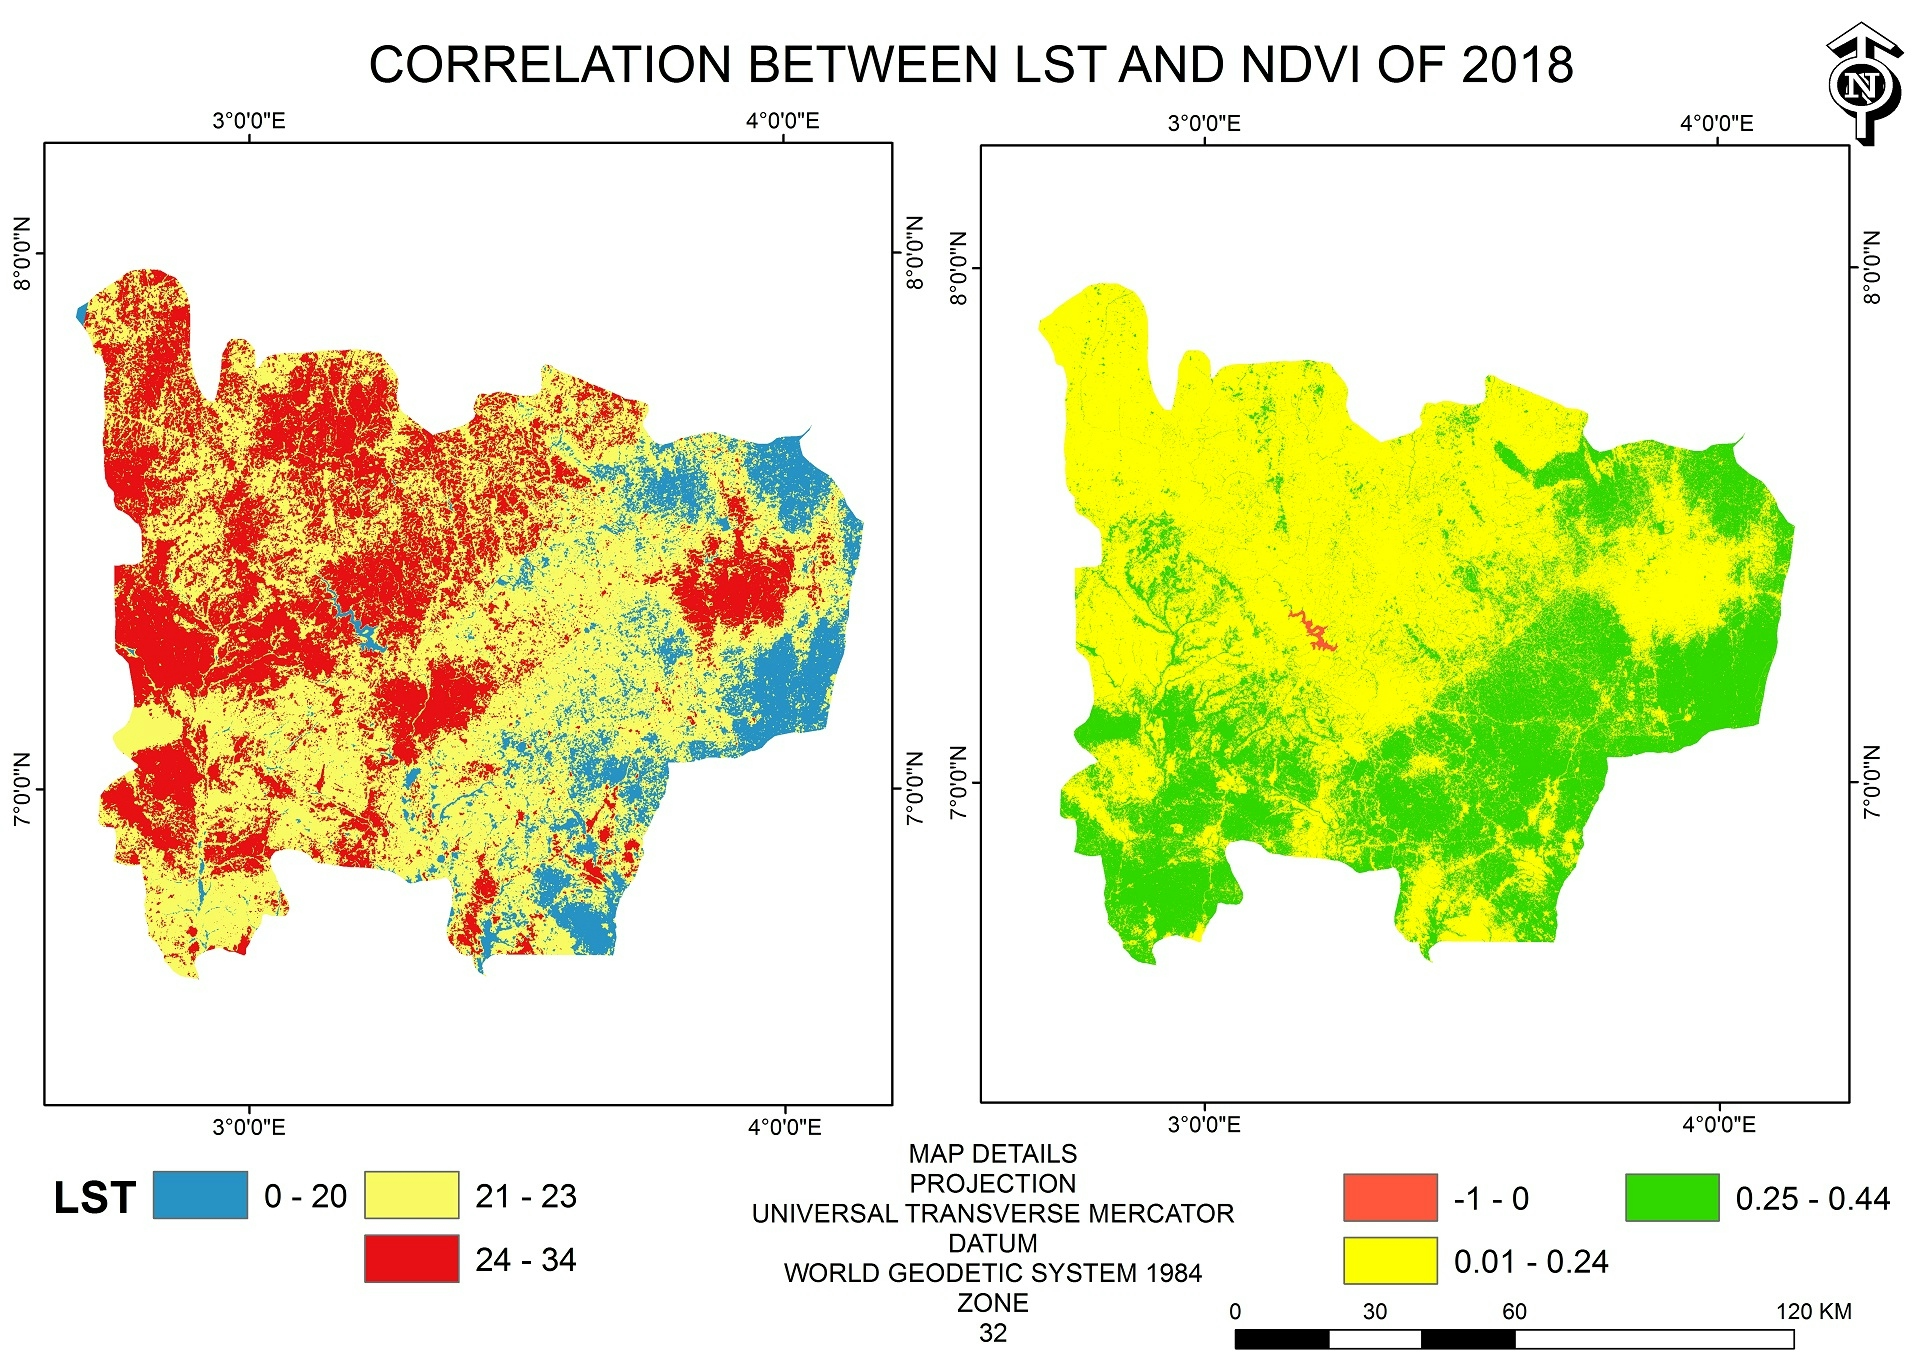
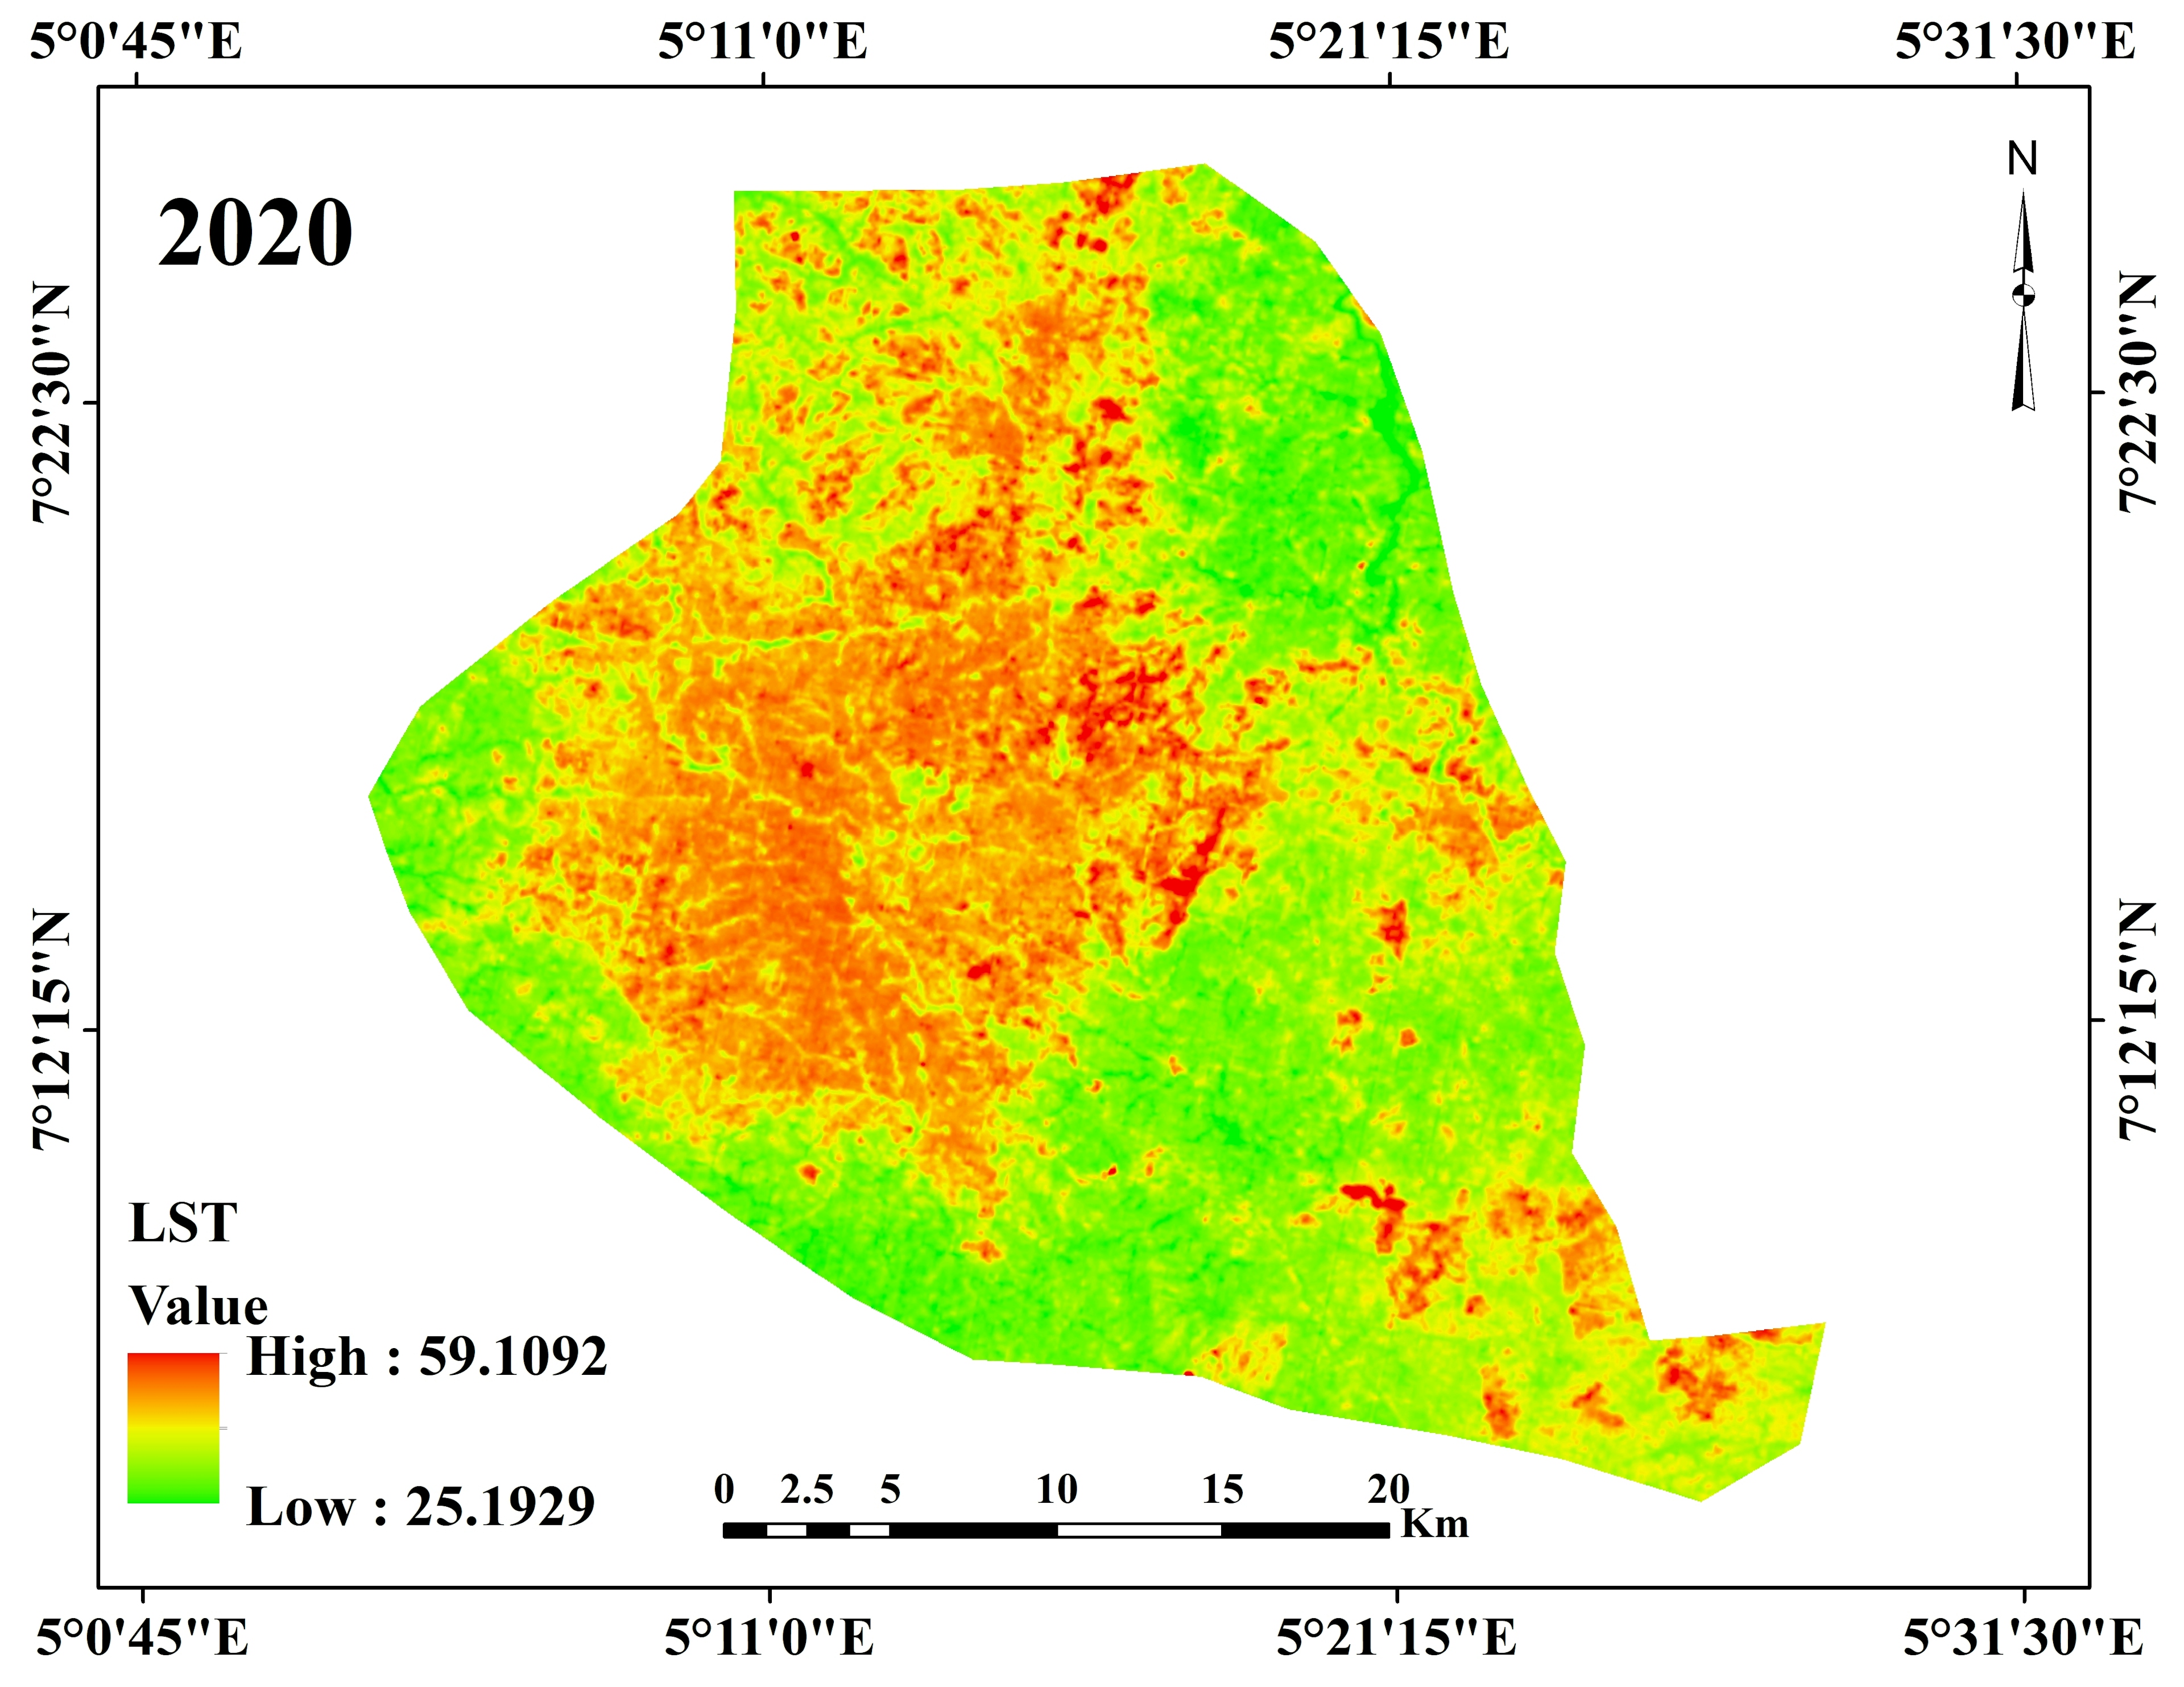
Landsat images were used for this analysis. ArcGIS was used to map out the study area, extract the data and create the layout image. Remote sensing techniques were applied in the processing of the temperature and vegetation indices. As implied from the image, areas with higher vegetation have lower temperatures and vice versa.
Correlation between LST and NDVI
Tools used
ArcGISArcMapGoogle Earth Engine(GEE)Remote SensingUSGS Earth Explorer
Plug-ins used
ArcGISData ManagementRaster FunctionsSpatial Analyst Toolbox
tags
ArcGISLand surface temperatureNDVI
More by Ojo Aladesola Monica


You might also like


Join the community!
We're a place where geospatial professionals showcase their works and discover opportunities.