
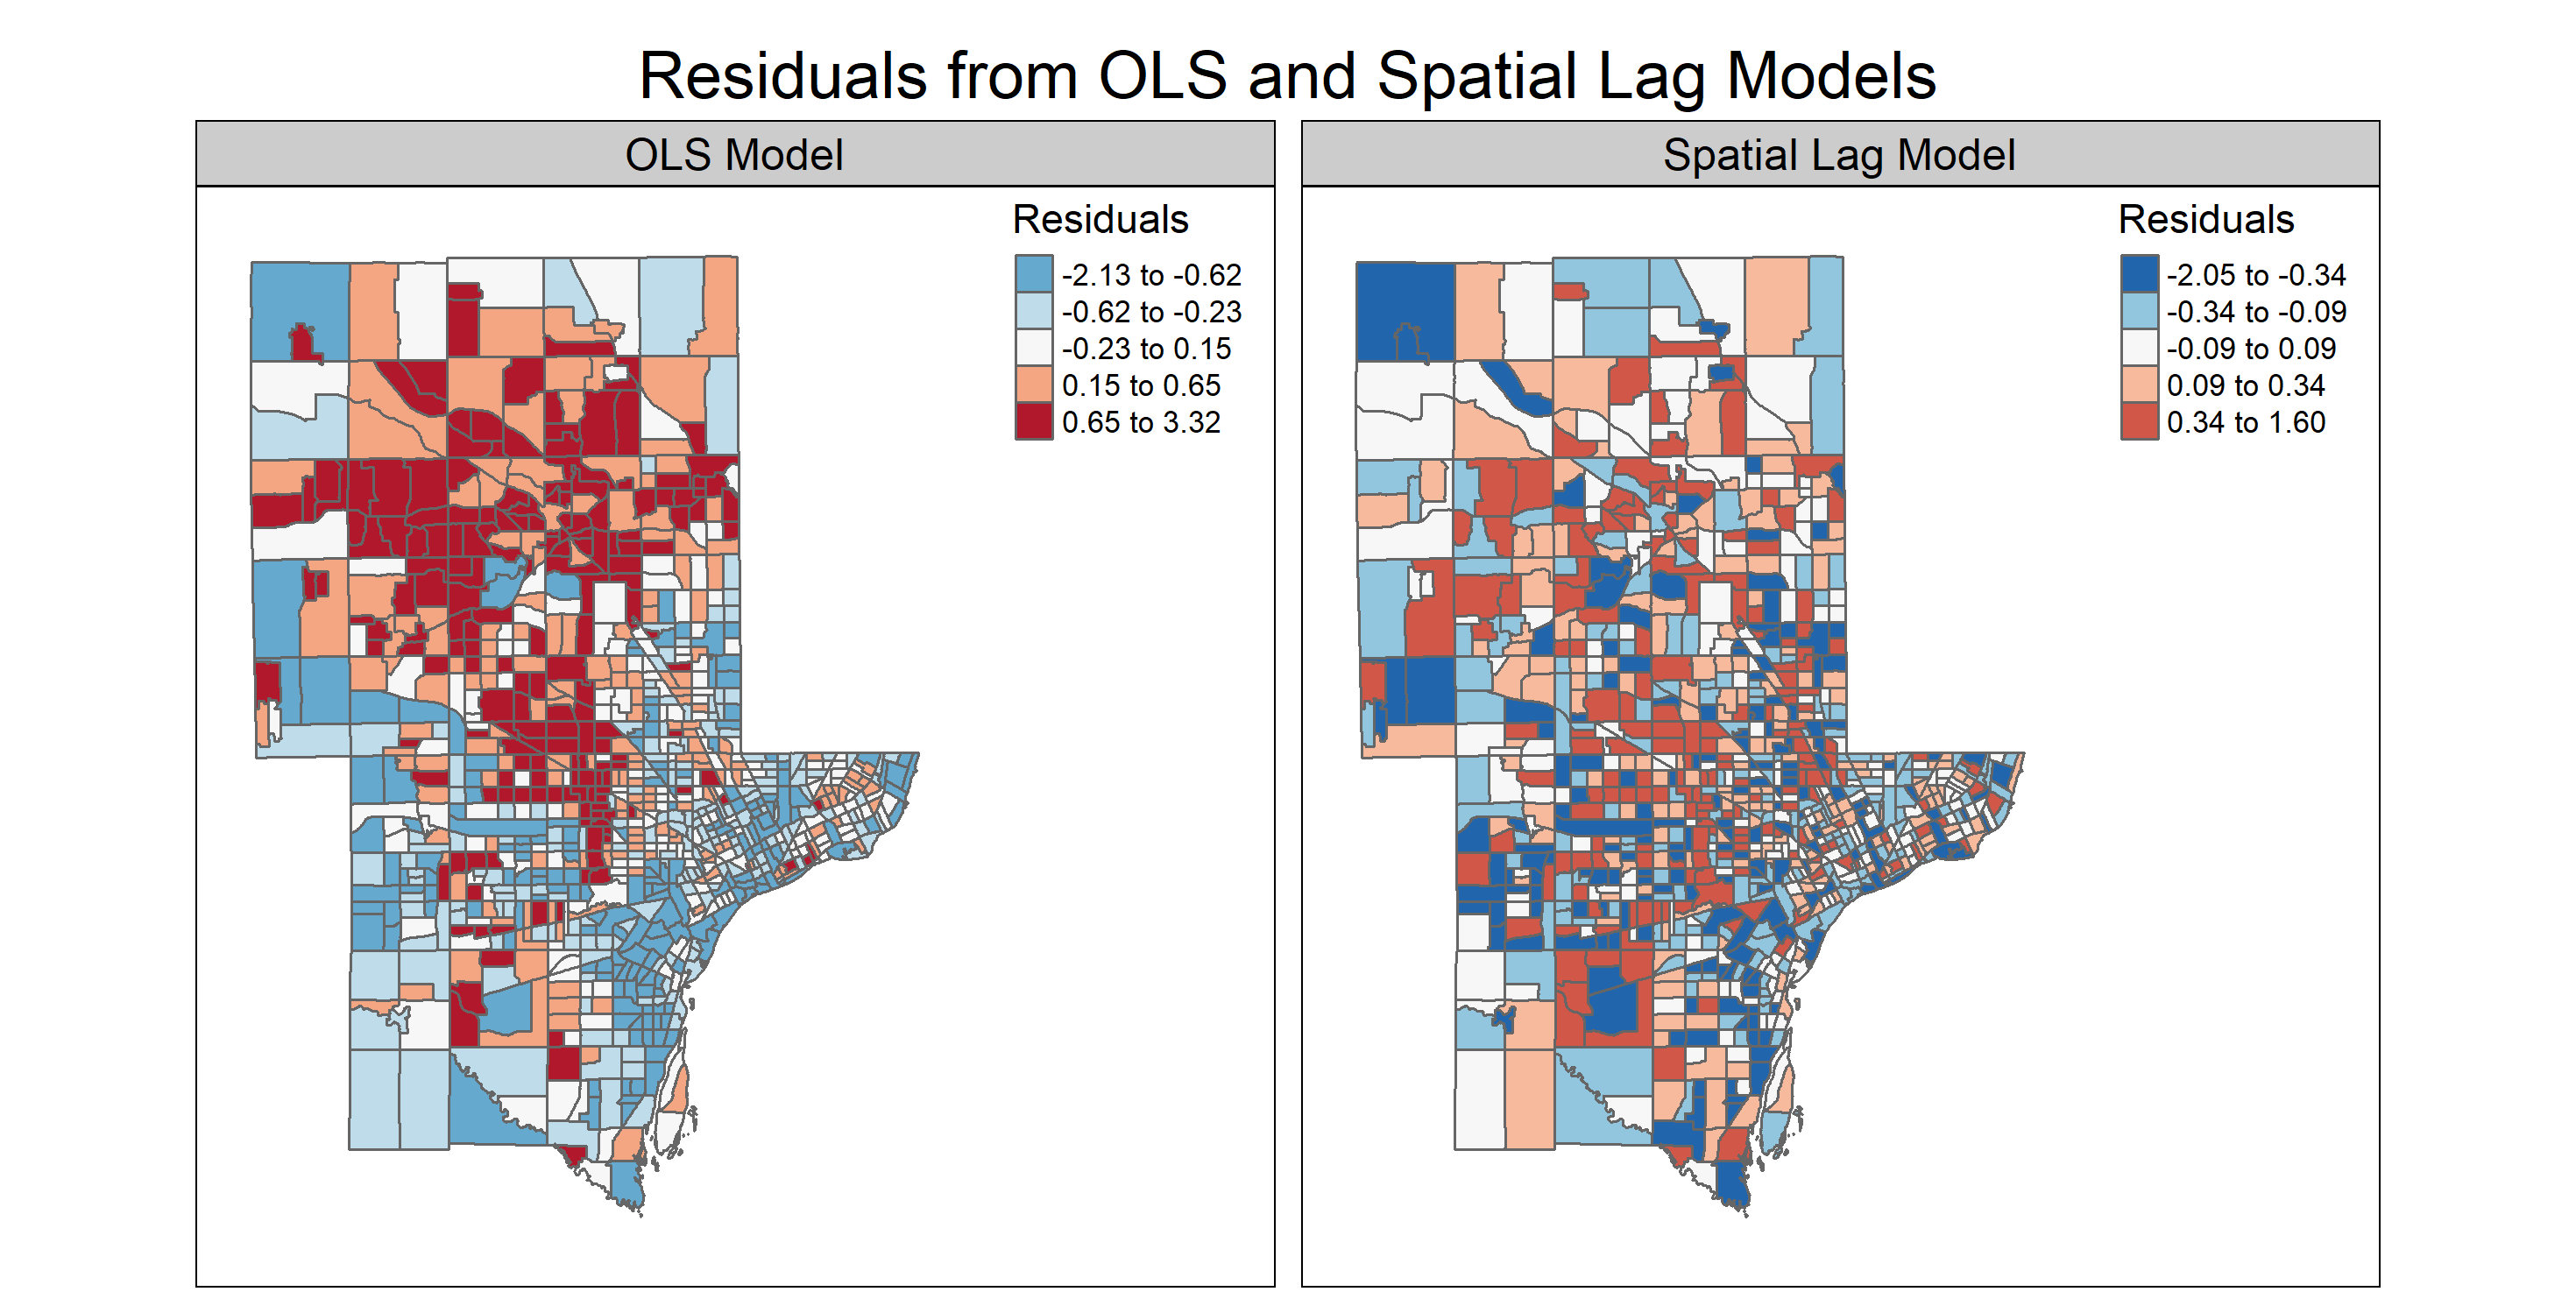
Chloropleth map of residuals from an OLS and spatial lag model describing percent canopy cover as a factor of median household income, census tract size, density of individuals who identify with a minority group, and density of households below the federal poverty level for Oakland and Wayne counties of Michigan. There is a clear spatial pattern in the residuals of the OLS model, violating the assumption of uncorrelated error terms. The spatial lag model accounts for spatial autocorrelation, therefore the error terms are more randomly distributed.
Spatial Regression for Canopy Cover Mich
Tools used
R Studio
Plug-ins used
lmtestsfspatialregtmap
tags
canopyspatial regression
More by Joe Pitti
You might also like


.svg "Keran Nkongolo")


Join the community!
We're a place where geospatial professionals showcase their works and discover opportunities.