INTRODUCTION
Coastal areas are areas between land and sea that are still influenced by sea and land factors. Coastal areas have become vulnerable to environmental damage issues, such as global warming and prolonged climate change. To determine the vulnerable coastal areas, it is necessary to calculate the Coastal Vulnerability Index (CVI) with benchmarks of physical parameters, including geomorphology, land use, coastal slope, elevation, distance from the coast, and lithology. In simple terms, the use of the variable is to determine the weighting of vulnerability parameters consisting of 4 groups, namely low, moderate, high, and very high. The data obtained becomes a parameter for measuring vulnerability in data management. The parameter represents a physical condition with a weighting of adjusted values. This potential vulnerability is assessed by including parameters in a table consisting of specific values in accordance with the USGS standardization.
Indonesia has more than 17,500 islands with a total coastline of about 80,000 km. The coast is a dynamic area of a process of destruction of various elements that exist in nature. Many large cities with densely populated areas such as Jakarta, Semarang, and Surabaya are located in coastal areas. Indonesia's coastal areas have geomorphological complex processes including degradation of the coastal environment due to natural hazards.
Cirebon Regency is one of the regencies in West Java that has a coastal area. The appearance of nature in the form of the coast makes Cirebon Regency will not separate from the influence of environmental damage. Global warming is characterized by rising sea levels in the Java Sea, it triggers an increase in the level of coastal vulnerability which can threaten life at any time. The threat of environmental change caused by natural and human factors in the form of pollution, excessive use of natural resources, coastal abrasion, and land use change that is not based on the environment also makes things worse.
METHODS AND DATA PROCESSING
Data processing that has been obtained, including geomorphological data, land use, coastal slope, elevation, distance from the coast, and lithology is processed using the Coastal Vulnerability Index (CVI). The data obtained becomes a parameter for measuring vulnerability in data management. Each parameter represents a physical condition with a weighting of adjusted values. This potential vulnerability is assessed by including parameters in a table consisting of certain values according to the standardization of values that have been issued by the USGS.
RESULTS AND DISCUSSION
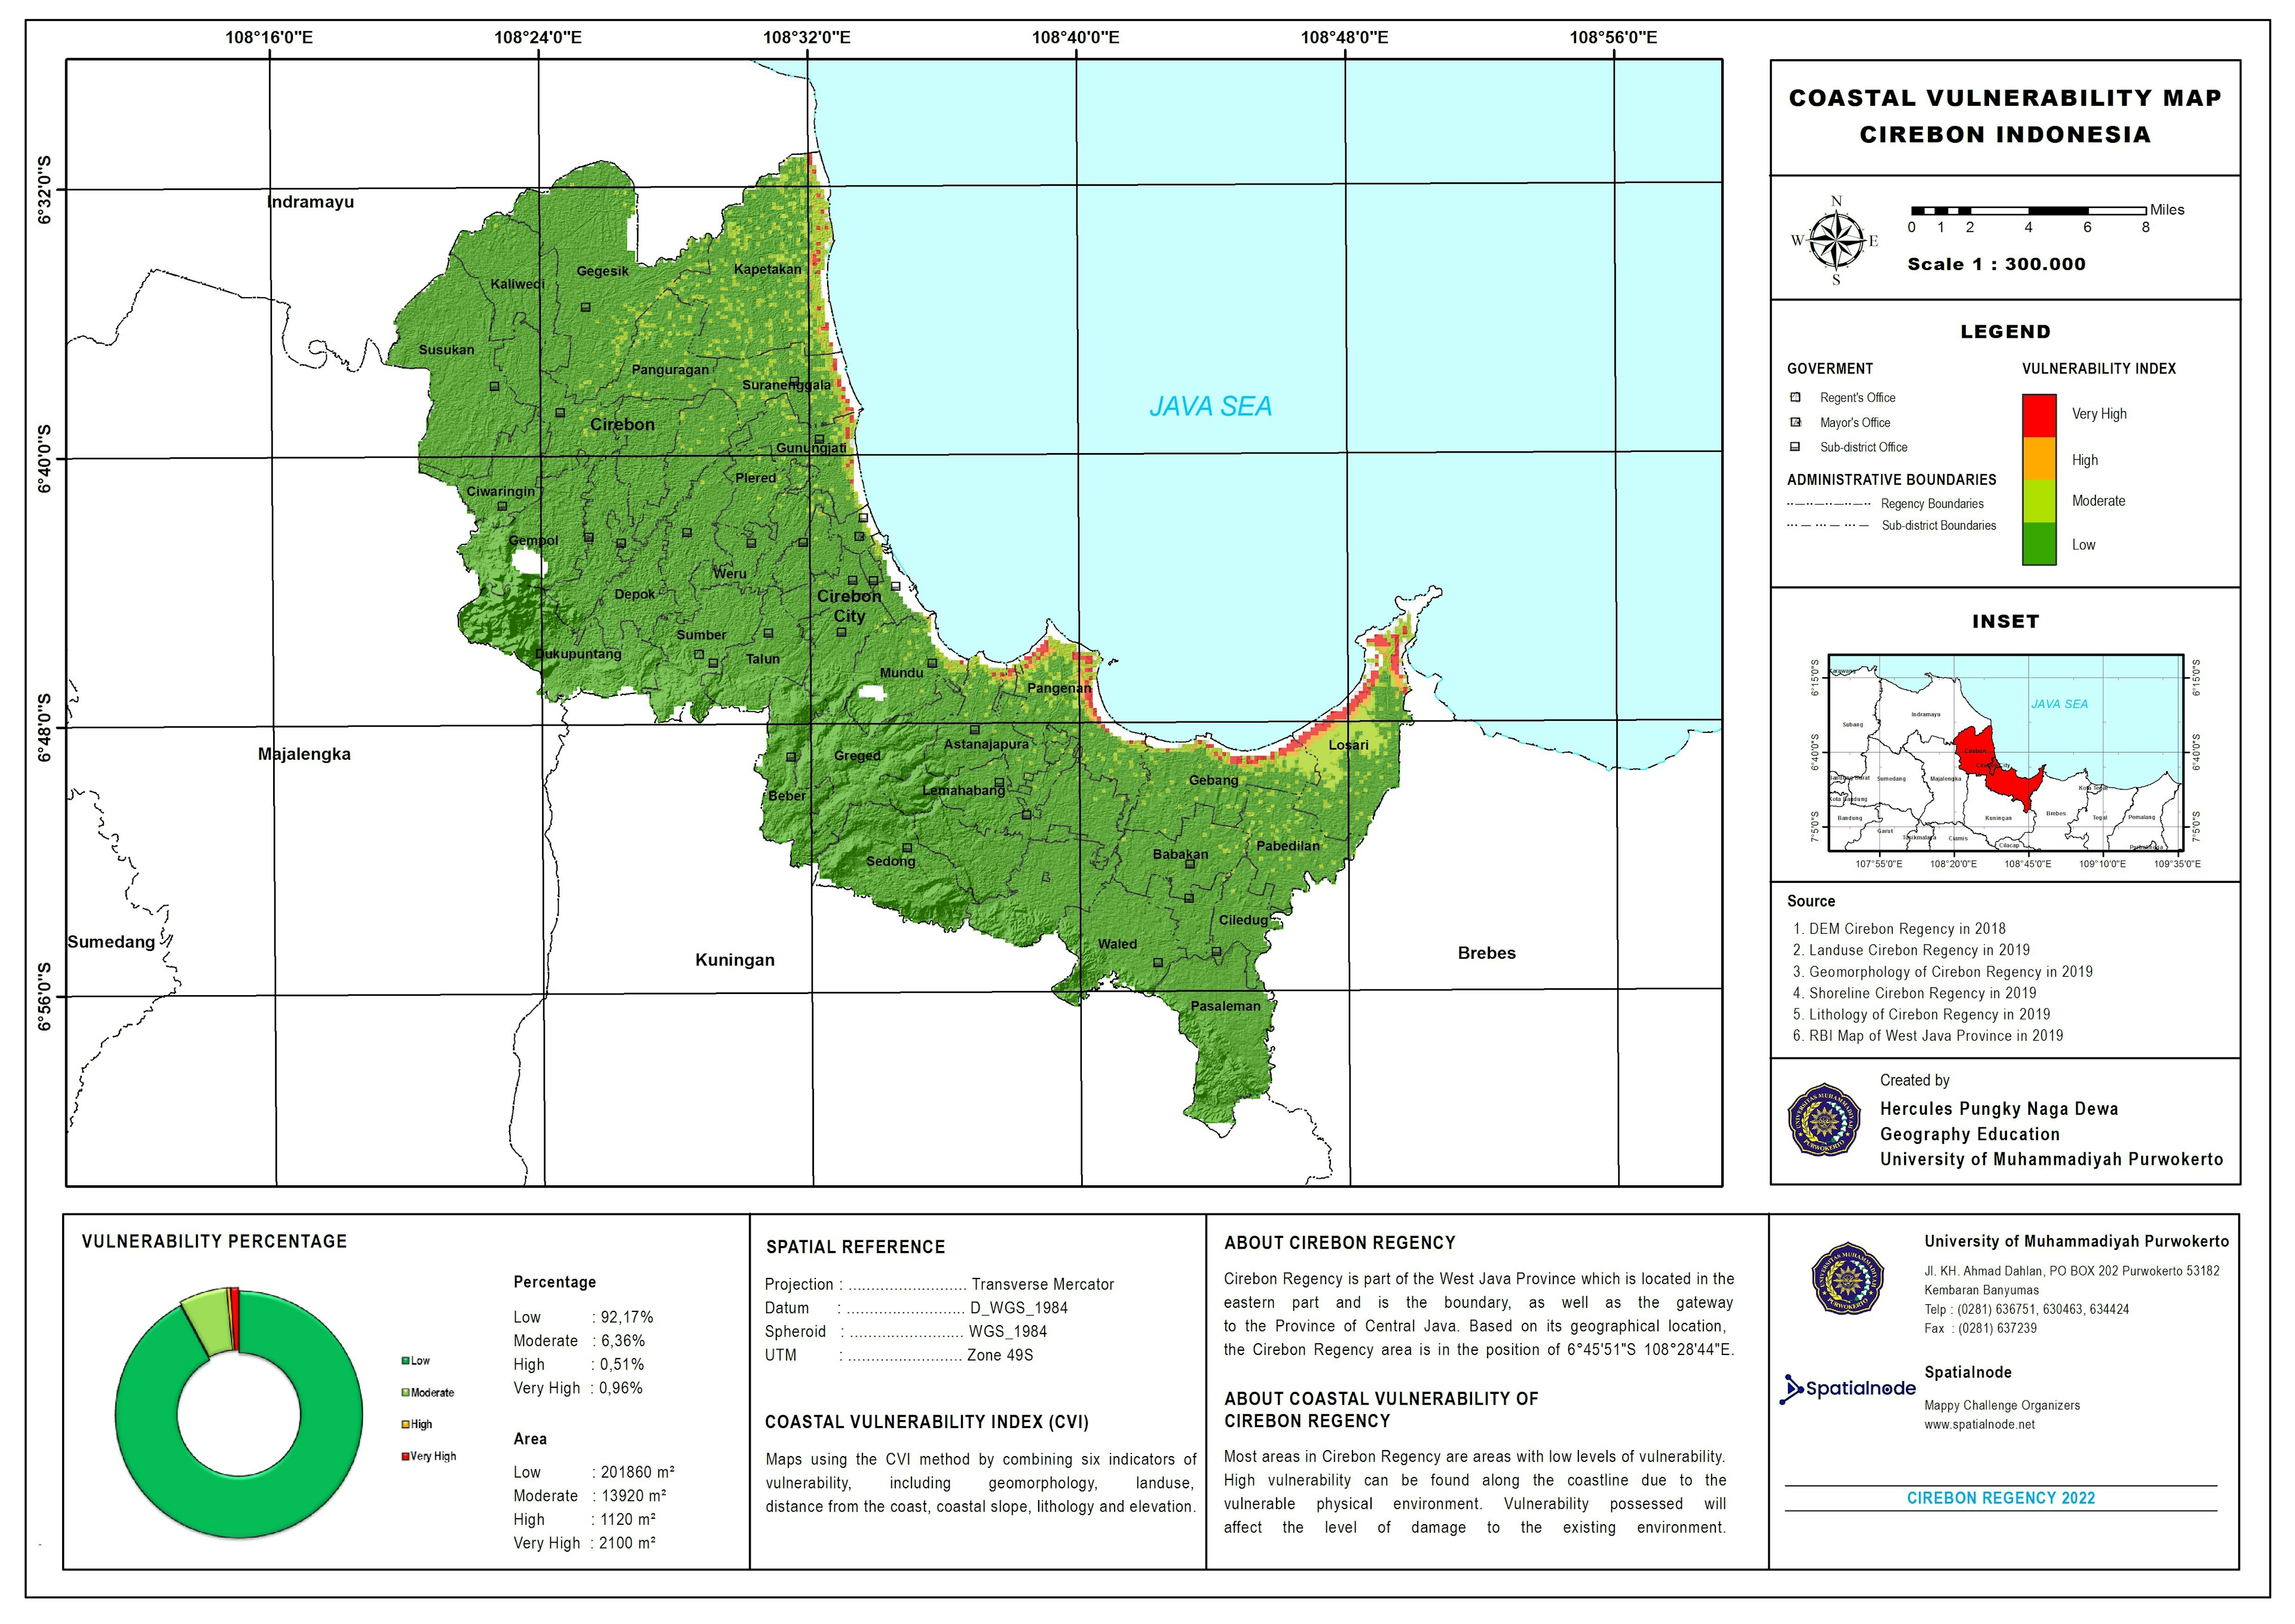
Based on the analysis of the map that has been produced, in general, the coastal vulnerability in Cirebon Regency is included in the low vulnerability level. The percentage of each vulnerability level is low (92.17%), moderate (6.26%), high (0.51%), and very high (0.96%). A high-level vulnerability is found along the coastline, but there are only a few of them. This is because the physical environment is vulnerable.
Districts that have a very high level of vulnerability in a row Kapetakan, Suranegala, Gunungjati, Pangenan, Gebang, and Losari districts. In addition, low-moderate susceptibility can be found in areas with a distance of >500 meters from the coastline, such as Susukan, Kaliwedi, Gegesik, Panguragan, Ciwaringin, Depok, Babakan, Ciledug, etc.
Coastal Vulnerability Based on Geomorphology
Coastal geomorphology is related to the appearance of coastal areas. Changes in coastal geomorphology resulted in a formation on the earth's surface that gave it its physical peculiarities. Coastal geomorphology in Cirebon Regency is based on existing appearances. The geomorphological data of Cirebon Regency obtained are secondary data or data that have been taken and classified by previous researchers. Coastal vulnerabilities based on geomorphology are classified into 5 levels of vulnerability. Vulnerability is very low (very steep ridges, plateau, alkaline volcanic plains, volcanic plains, volcanoes, and lava slopes), low (combined plains), moderate (low hills/hills and small hills), high (alluvial fans), and very high (sedimentary plains, water bodies, swamps).
Coastal Vulnerability Based on Land Use
Land use in Cirebon Regency has undergone changes that have a direct impact on the ecosystem order in the region. Based on land use data from Cirebon Regency, the existing land use is in the form of built-up lands, such as settlements, ponds, mining, and rice fields. Some areas have not been utilized into built-up areas, such as open land areas and shrubs. Based on the use of the land, it is then included in the vulnerability index which is successively divided into five classes, namely very low (open land), low (thickets), moderate (forest plantations), high (mining, dryland agriculture, mixed dry land agriculture) and very high (water bodies, airports, ports, settlements, rice fields, ponds).
Coastal Vulnerability Based on Coastal Slope
The slope of the coast can affect the accumulation of sediment (accretion) causing instability in the coastal area. Information about the slope of the coast was obtained by reclassifying DEM (Digital Elevation Model) data issued by the Indonesian Geospatial Information Agency in 2018. Slope classification to determine the degree of vulnerability using the classification made by previous researchers. The vulnerability indices by degree of slope are divided into five classes, namely very low (0 ° - 0.025°), low (0.025° - 0.04°), moderate (0.04° - 0.07° - 0.07°), high (0.07° - 0.2°) and very high (>0.2°). Before the division of the five classes, researchers used the Slope tool on GIS software (ArcGIS) and reclassified the slope into vulnerability classes.
Coastal Vulnerability Based on Distance from the Coast
The distance data from the coastline required in making a map of coastal vulnerability was obtained by creating a coastline by looking at satellite imagery. Classification of coastal distances using the classification made by previous researchers. The vulnerability index based on the distance from the coast (meter units) is each divided into five classes, namely very low (1000 meters), low (750 meters), moderate (500 meters), high (250 meters), and very high (50 meters). To divide the class, researchers used the Euclidean distance tool in the GIS software (ArcGIS 10.3).
Coastal Vulnerability Based on Elevation
Elevation data was obtained by reclassifying DEM (Digital Elevation Model) data issued by the Indonesian Geospatial Information Agency in 2018. Elevation classification to determine the level of vulnerability using a classification that is divided into five classes, namely very low (>30 meters), low (20-30 meters), moderate (10-20 meters), high (5-10 meters) and very high (0-5 meters).
Coastal Vulnerability Based on Lithology
Lithological data is data that contains information about the grouping of rock sequences. Lithological data is quite important in weighting coastal vulnerabilities. Lithological data was obtained by taking secondary data from the Indonesian Geospatial Information Agency in 2019 which was subsequently reclassified. The lithological classification is divided into five classes, namely very low (compact and hard igneous, sedimentary and metamorphic rocks), low (sedimentary, fine-grained, compact, and soft), moderate (gravel and sand are rather compact), high (sand, silt, clay rather compact) and very high (sand, silt, loam, mud). In the lithology data of Cirebon Regency itself, there are various lithology classes which are then classified based on the vulnerability index. It starts from very low susceptibility (intrusive: intermediate, extrusive: intermediate: polymict, extrusive: intermediate: lava, extrusive: intermediate: pyroclastic), low (sedimentary: clastic: fine: claystone/sediment: clastic: coarse: conglomerate), moderate (sediment: clastic: moderate: flysch), high (sediment: clastic: fine: marl) and very high (sediment: clastic: alluvium).
The vulnerability parameters above have been reclassified with the vulnerability index, then the vulnerability level will be calculated with the Coastal Vulnerability Index (CVI) weighting formula. The weighting formula is calculated using a raster calculator with SquareRoot in ArcGIS 10.3 software. Raster calculator with SquareRoot can be written with the following formula:
SquareRoot((“Reclass_Geomorphology.tif” * “Reclass_Landuse.tif” * “Reclass_Slope.tif” * “Reclass_ED-Beach.tif” * “Reclass_Elevation.tif” * “Reclass_Lithology.tif” / 6))
Then, the next step in making a coastal vulnerability map is to provide representative symbology, calculate the area of the area and calculate a certain level of vulnerability.
As far as researchers make maps of coastal vulnerabilities, Cirebon Regency does need more attention related to this condition. Because although coastal vulnerabilities cannot be said to be vulnerable, the threats that will come at any time will hit. Moreover, the location along the coast has been used as a built-up area. Therefore, consideration of these threats can be a reference and guideline in setting coastal zone management policies.
CONCLUSION
Based on the calculation of vulnerability parameters, in general, the coastal vulnerability in Cirebon Regency is included in the low vulnerability level. The percentage of each vulnerability level is low (92.17%), moderate (6.26%), high (0.51%), and very high (0.96%). A high-level vulnerability is found along the coastline. Although coastal vulnerabilities cannot yet be said to be vulnerable, the threats that will come at any time hit. Moreover, if the location along the coast has been used as a built-up area, changes in the physical environment will certainly result in changing natural events. To anticipate this, consideration of the threat can be a reference and guideline in coastal zone management policy arrangements. District governments need to pay attention and be aware if the increase in the number of residents and environments that change functions quickly will have an impact on the magnitude of the coastal vulnerability rate.
ACKNOWLEDGMENTS
The researcher would like to thank the Indonesian Geospatial Information Agency for providing convenience in collecting spatial data. In addition, the researchers would like to thank the previous researchers for providing useful references in making a map of the coastal vulnerability of the Cirebon Indonesia Regency. And most of all, thanks to the Geography Education University of Muhammadiyah Purwokerto in this regard Dr. rer. nat. Anang Widhi Nirwansyah, M.Sc. has guided researchers to study coastal vulnerabilities in Cirebon Regency.
_9083060.png&w=3840&q=100)


.png&w=3840&q=100)
 He")


.svg "Keran Nkongolo")