
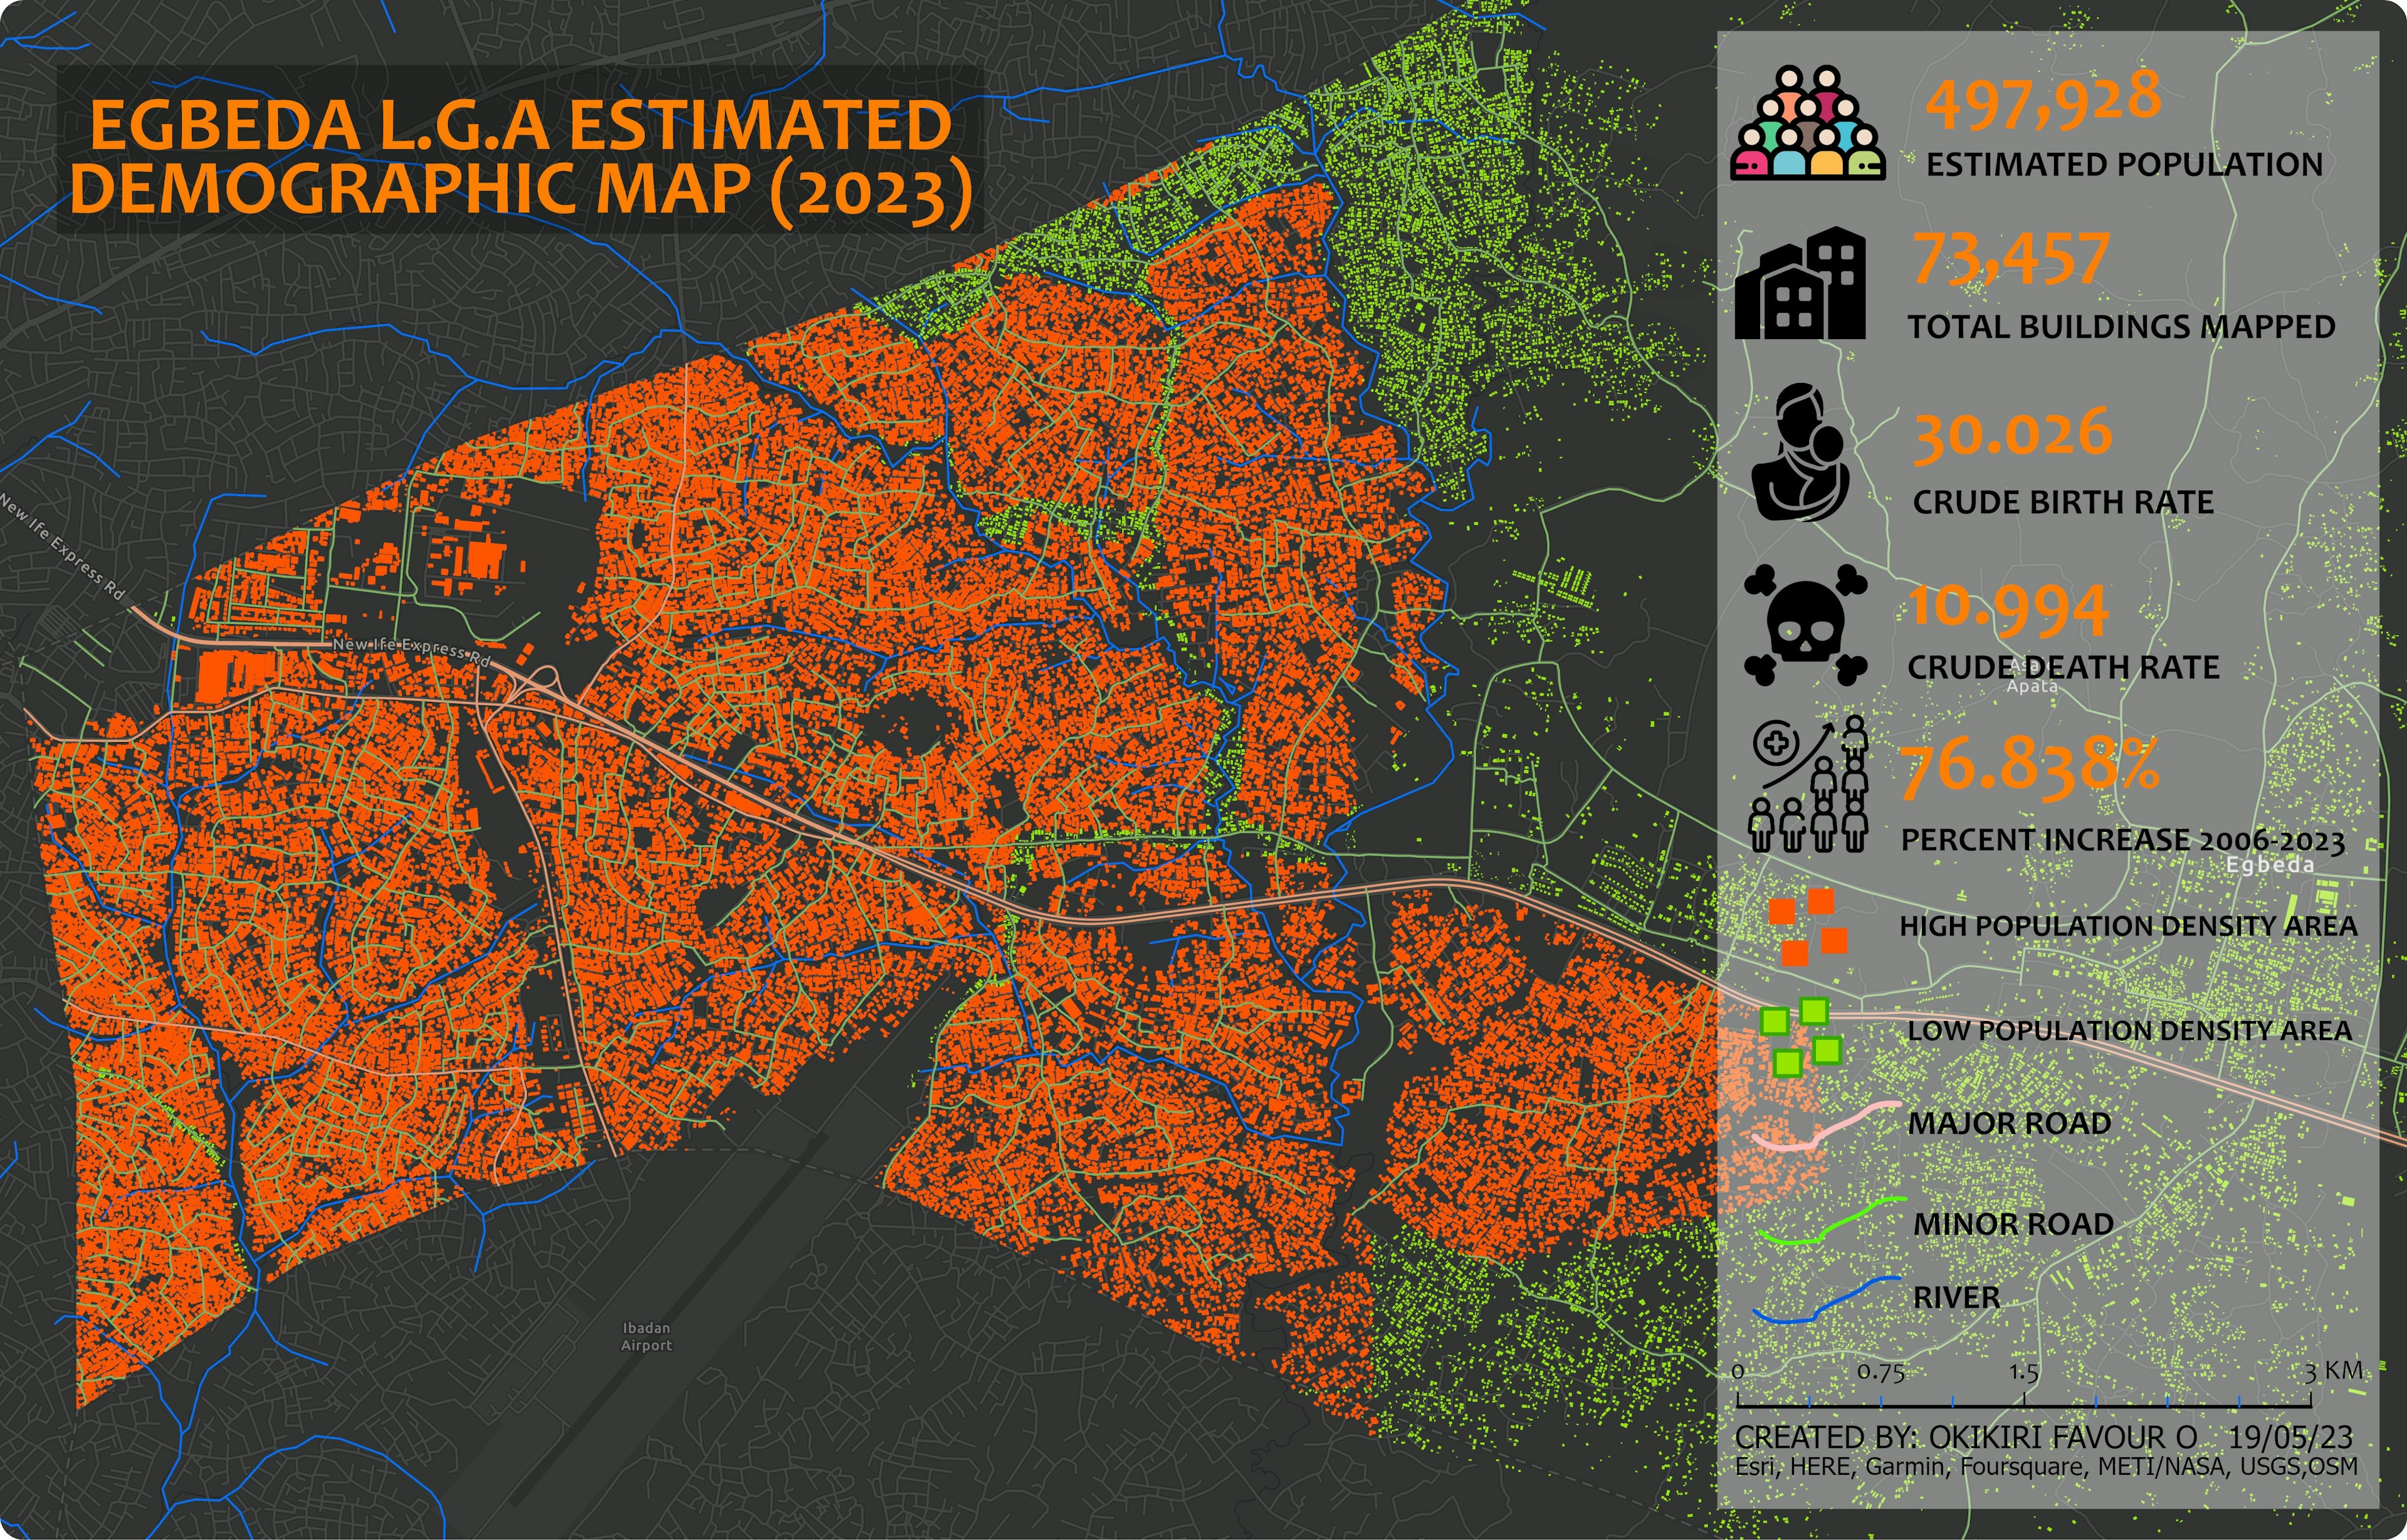
Creating this demographic map took care and attention through each step of the mapping workflow. I first needed to source recent building footprint data and reliable census data at the LGA level. After acquiring the dataset, I loaded it into GIS software and geocoded the attributes to geographic units. I then classified the data into suitable ranges representing low, medium and high population density. Using best practices for thematic mapping, I selected an intuitive color scheme and applied the symbology to the polygons. Finally, I added other cartographic elements like a title and legend to produce an informative, understandable map. Let me know if you have any other questions about the data processing, analysis, or design choices that went into making this visualization!
Demographics of Egbeda LGA, Oyo state.
Plug-ins used
QuickOSM
tags
#FUTAGISday2023
You might also like


.svg "Keran Nkongolo")
Join the community!
We're a place where geospatial professionals showcase their works and discover opportunities.