
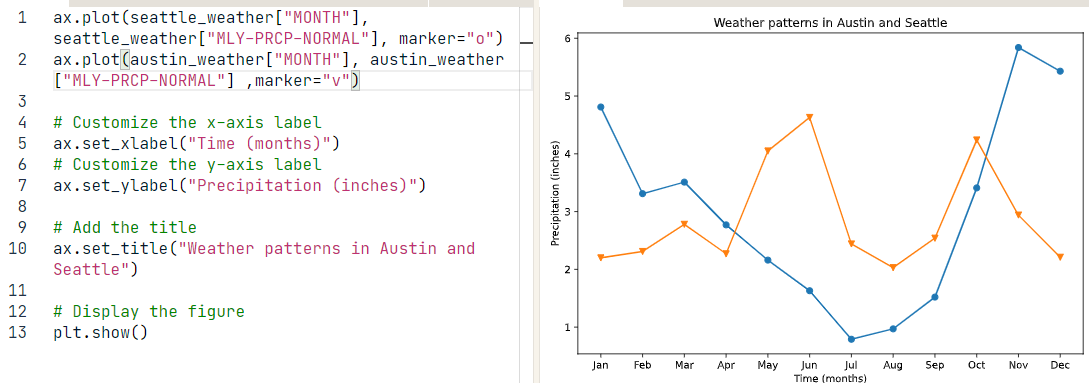
Using Python, we can visualize the precipitation data of Seattle and Austin in an engaging and informative way. We can use the matplotlib library to create a line graph to compare the monthly precipitation of both cities over a set period of time. The line graph can be further enhanced by adding labels for the months, colors for each city, and a legend to identify the cities. Additionally, we can create a bar graph to compare the yearly precipitation of both cities, which can be further enhanced by adding labels for the years, colors for each city, and a legend to identify the cities. Finally, we can create a scatter plot to compare the average monthly precipitation of Seattle and Austin. This can be further enhanced by adding labels for the months, colors for each city, and a legend to identify the cities. By using Python to visualize the precipitation data of Seattle and Austin, we can gain a better understanding of the differences in precipitation between the two cities.
Data Visualization using Python
Tools used
ju
Plug-ins used
Matplotlibseaborn
tags
climate changeUNUnited States
More by Peter Ndiritu Thuku


You might also like


Join the community!
We're a place where geospatial professionals showcase their works and discover opportunities.