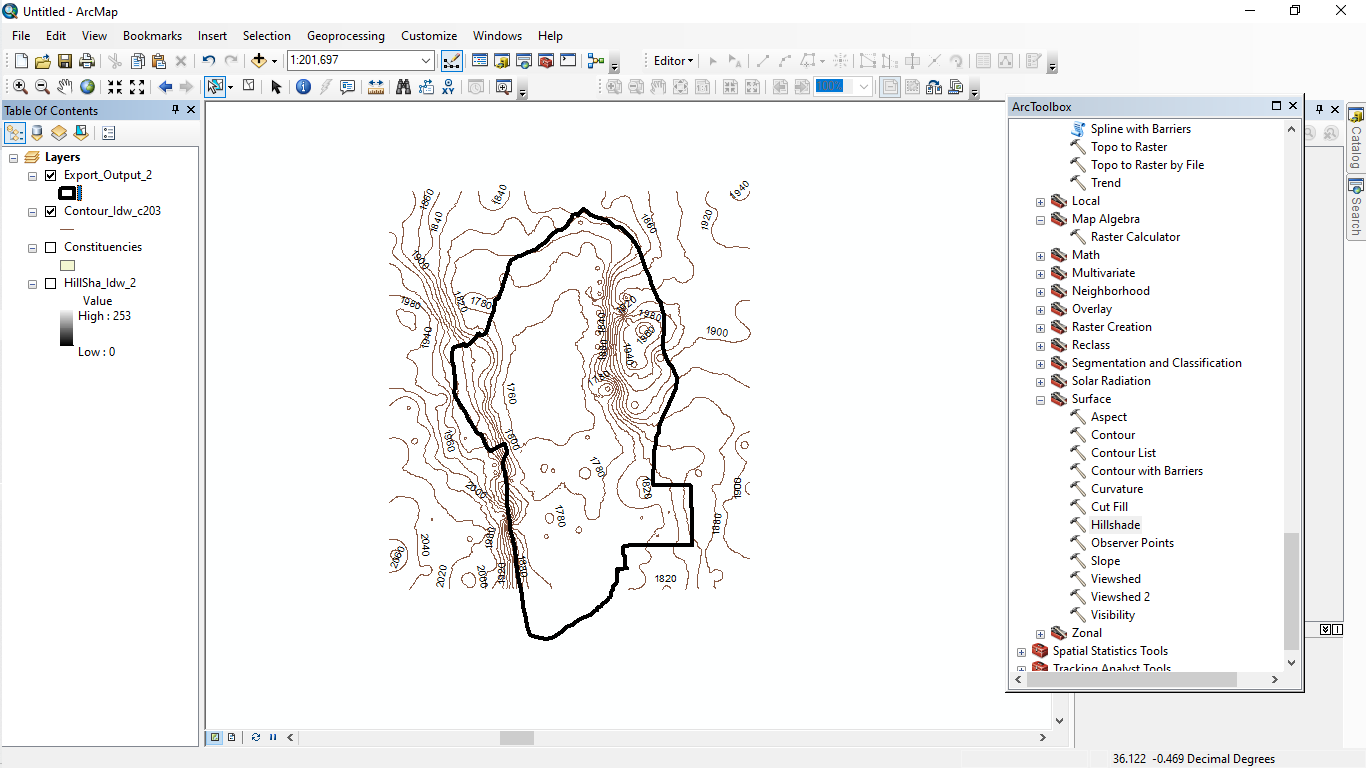
Contour lines are lines on a map that represent points of equal elevation. They are commonly used in topographic maps to show the shape and steepness of terrain.
ArcMap and Google Earth Pro are both geographic information system (GIS) software programs that can be used to generate contour lines from elevation data. ArcMap is a desktop GIS software developed by Esri, while Google Earth Pro is a free GIS software developed by Google.
To generate contour lines using these software programs, you will need to import elevation data, such as a digital elevation model (DEM), into the software. The software will then use algorithms to calculate the contour lines based on the elevation data.
Once the contour lines have been generated, they can be displayed on a map to give a visual representation of the terrain. The contour lines will typically be displayed as a series of concentric lines with elevations labeled at regular intervals.
In summary, generating contours using ArcMap and Google Earth Pro involves importing elevation data and using algorithms to calculate the contour lines, which can then be displayed on a map to show the shape and steepness of terrain.