Final Project for GUS 8065 - Cartographic Design at Temple University Fall 2021.
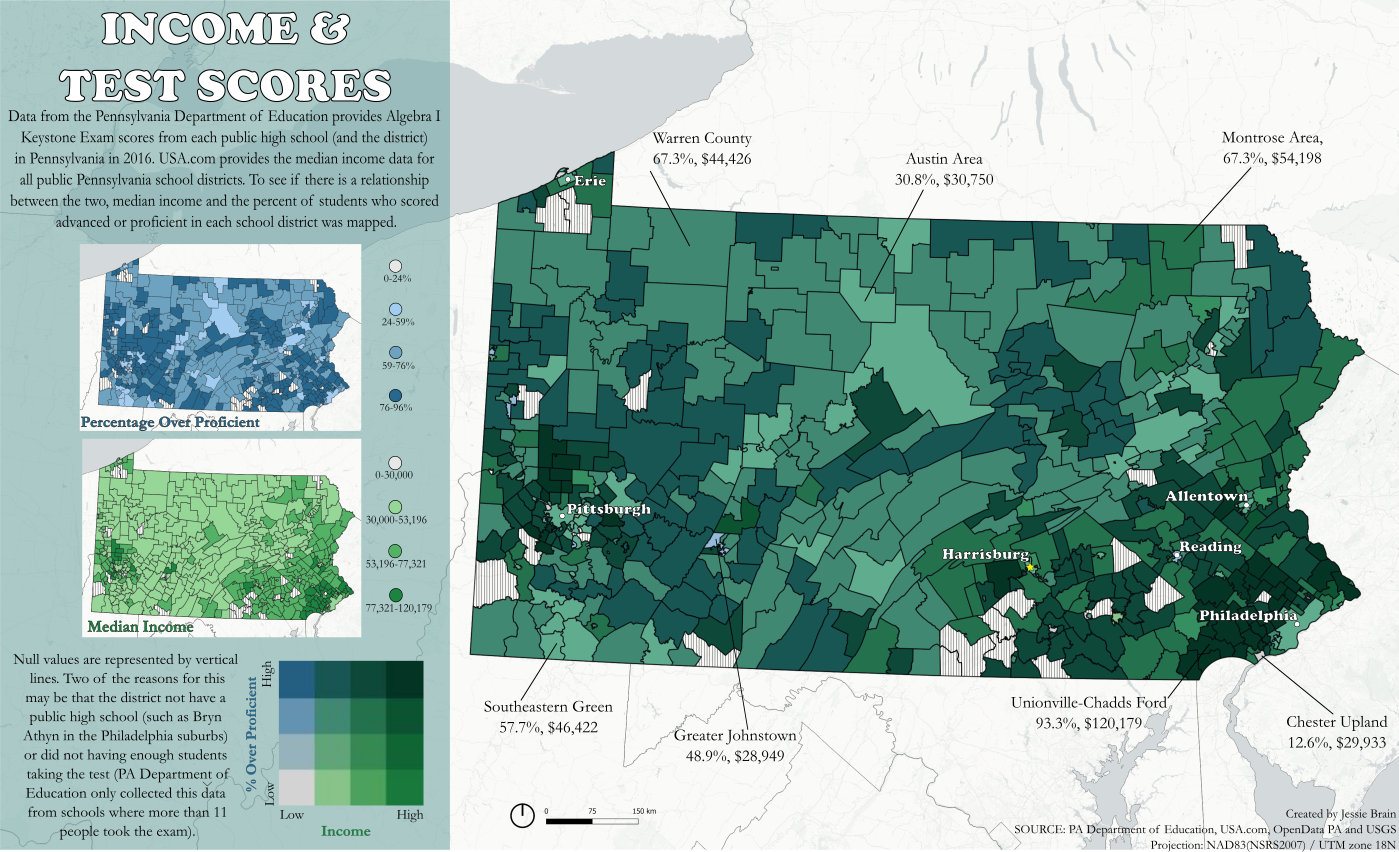
This infographic was created to view the relationship between median income per Pennsylvania school districts and percentage of passing math Keystone exam scores. The Keystone exam score data were provided by the PA Department of Education and USA.com provided the median income per school district data. OpenDataPA provided the school district shapefile.