Phytoplankton are microscopic, plant-like organisms which use chlorophyll to harness energy from the Sun for growth and are an essential part of the marine food web. Phytoplankton blooms are a phenomena which can occur seasonally, as waters warm up in the spring and summer along with waters becoming rich with nutrients. Unusually warm waters along with influxes of nutrients can also cause phytoplankton blooms to occur out of season, such as in the fall.
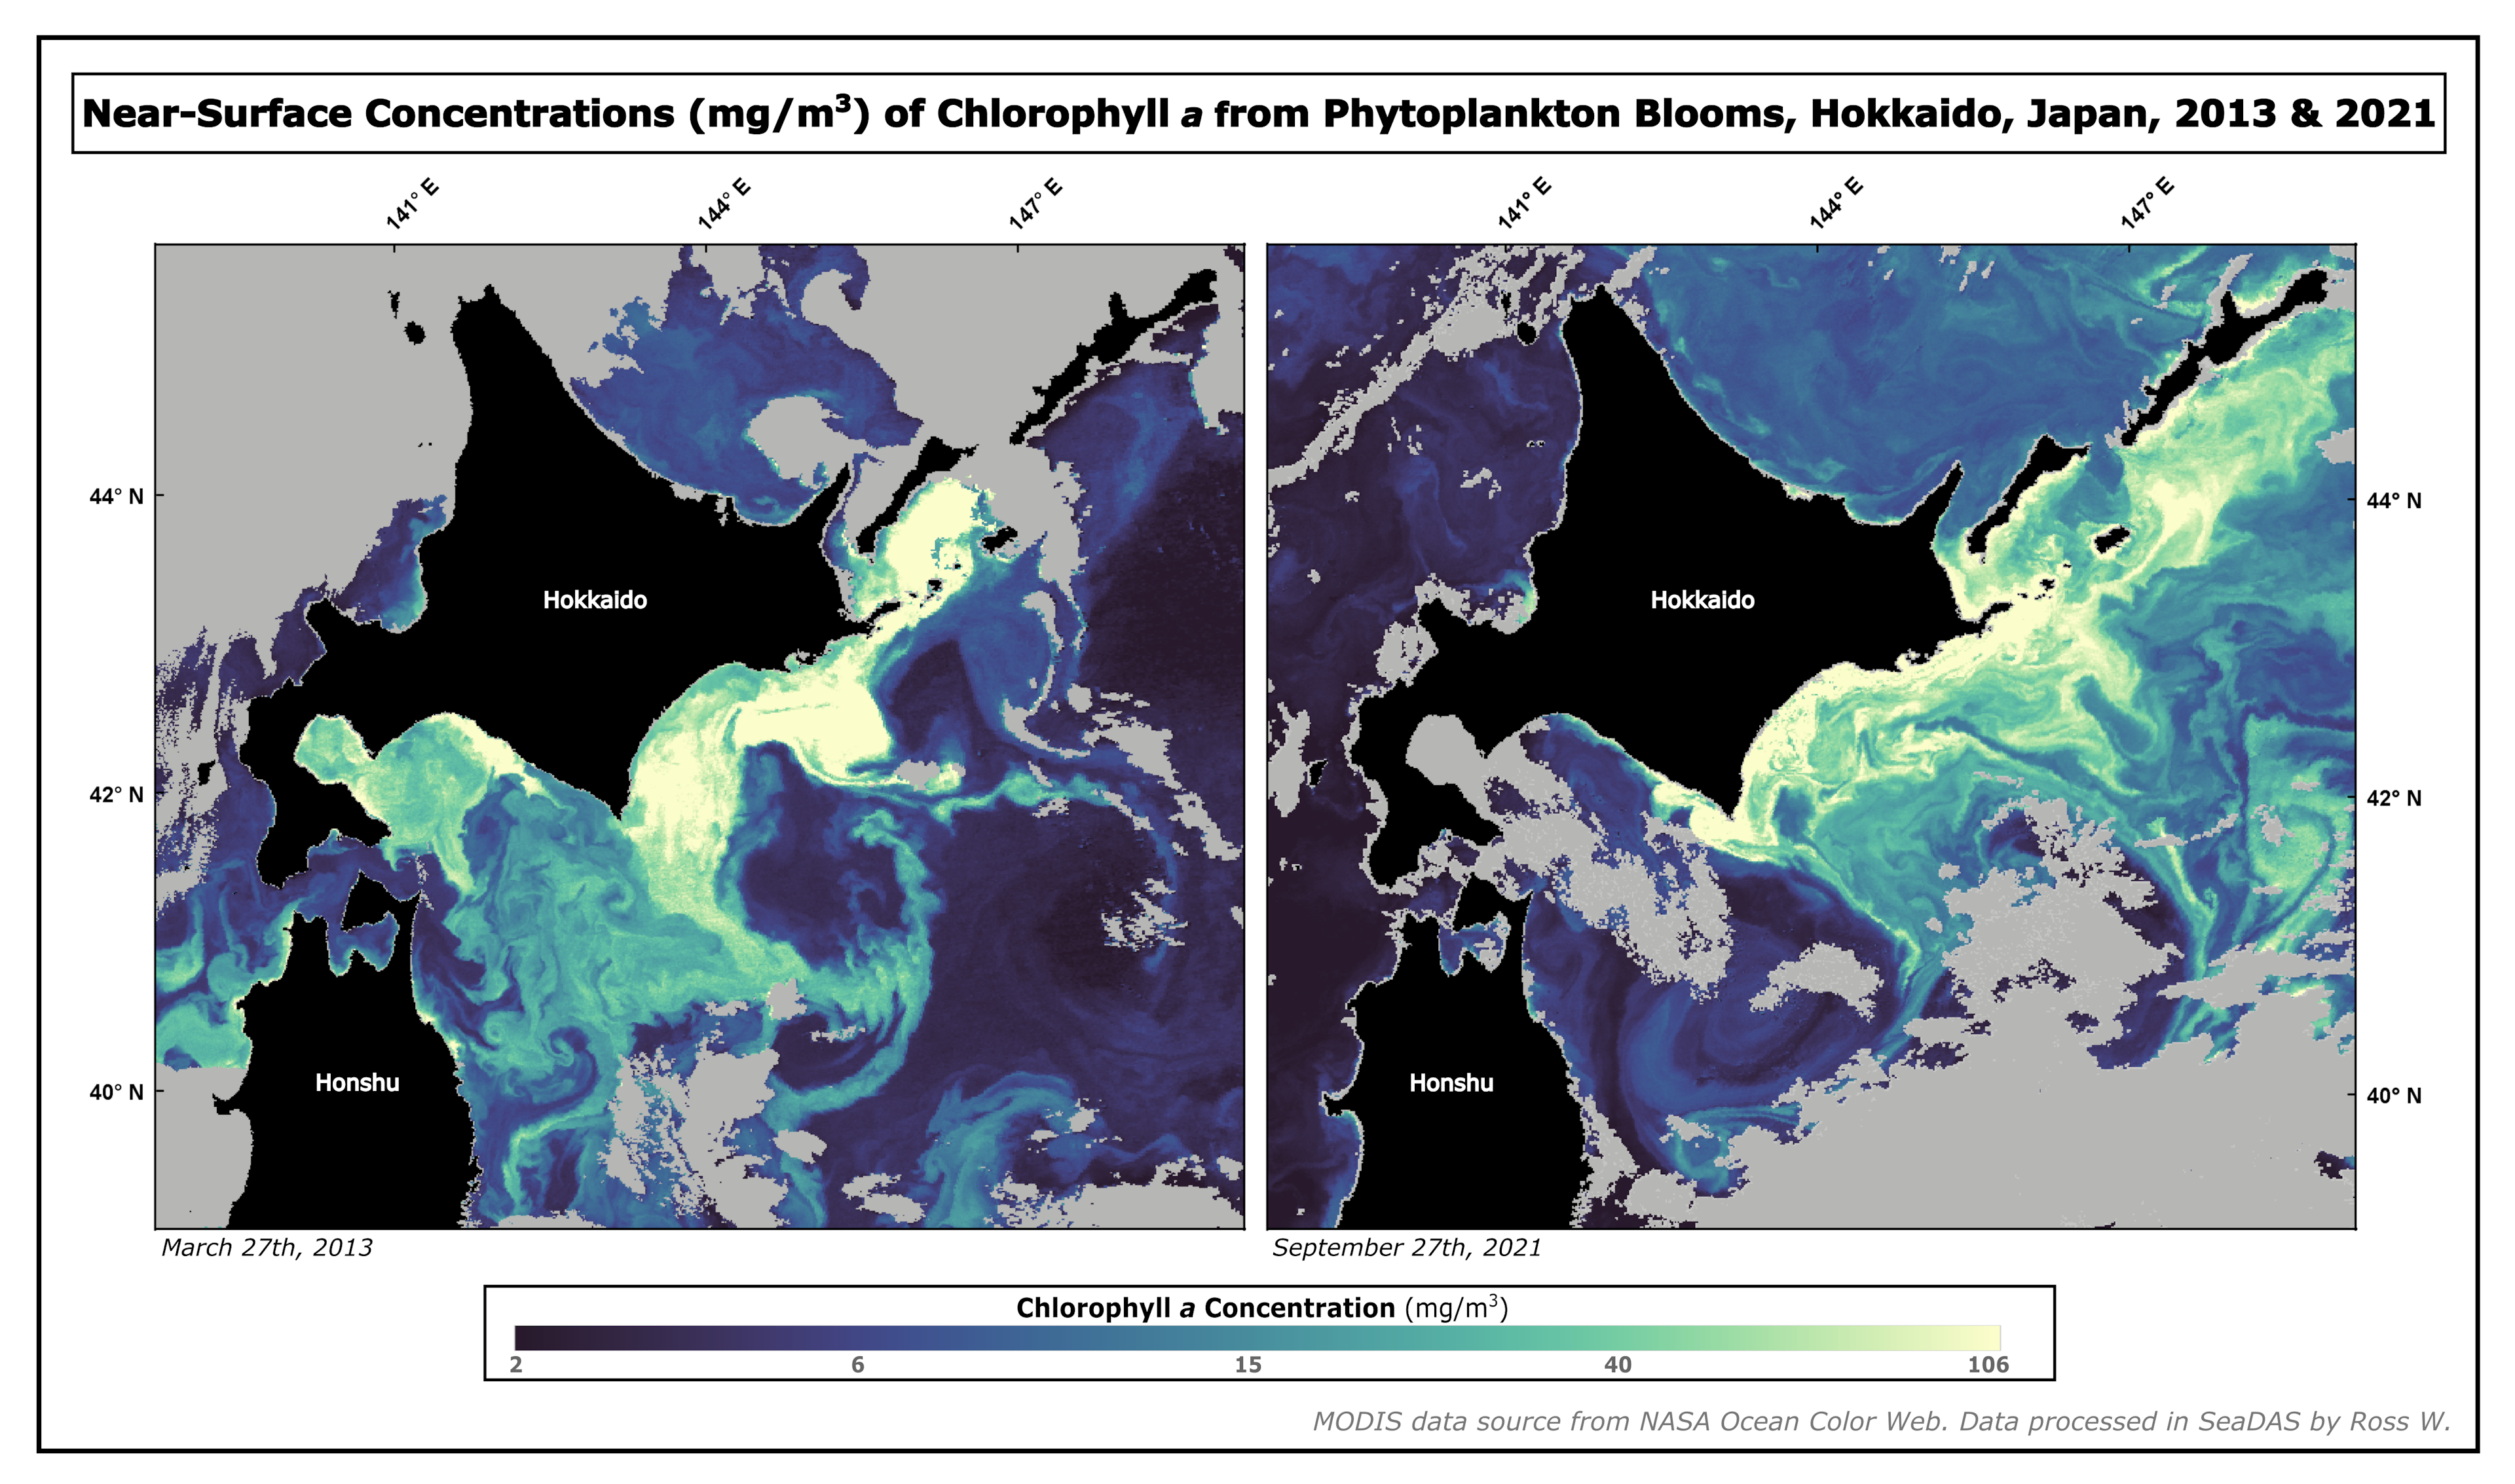
The above two images show two such blooming events which occurred in the waters off Japan’s second largest island, Hokkaido (北海道). The left hand image, from March 27th, 2013, depicts a spring seasonal phytoplankton bloom, which are common on the east coast of Japan’s main island, Honshu (本州), but less common off the coast of Hokkaido. The right hand image shows a rare fall phytoplankton bloom near Hokkaido, which resulted in an event known as a “red tide”, that resulted in the death of many marine organisms and had a devastating economic impact to Japan’s fishery.
Increased water temperatures due to climate change can cause algal bloom events to occur with more frequency and intensity both during normal blooming seasons and outside of them. Impacts of algal blooms, such as in the case of “red tides” and mass dying of marine life can have devastating impacts not just for life in the oceans, but also on food supply and economies. Detection of algae using remotely sensed data provides a strong tool for detecting extent of algal blooms and detailing trends over time.
The images are both from the MODIS (Moderate Resolution Imaging Spectroradiometer) sensor aboard NASA’s Aqua satellite. The imagery was retrieved from the NASA Ocean Color Web data portal (https://oceancolor.gsfc.nasa.gov/). The imagery was processed in NASA’s SeaDAS software, using the MODIS chlorophyll-a concentration algorithm. The algorithm produces a product which displays the near-surface concentration of chlorophyll-a (contained in phytoplankton) in mg/m-3. The algorithm calculates concentrations based on the relationship between the MODIS reflectances in the 440-570 nm range, and in situ measurements of chlorophyll-a and blue green band ratios of in situ remote sensing reflectances.
The black areas in the image are land areas, which were blocked out using a Land Mask. Similarly, the areas in grey are areas of cloud which were blocked out using a Cloud Mask. Areas in purple represent the lowest concentrations of chlorophyll-a (and therefore, the lowest concentrations of phytoplankton) and the areas in yellow represent the highest chlorophyll-a concentrations.
The final map product was created and processed in Adobe Illustrator.