note :
the data source: coursera
course: Fundamentals of GIS
Project Description
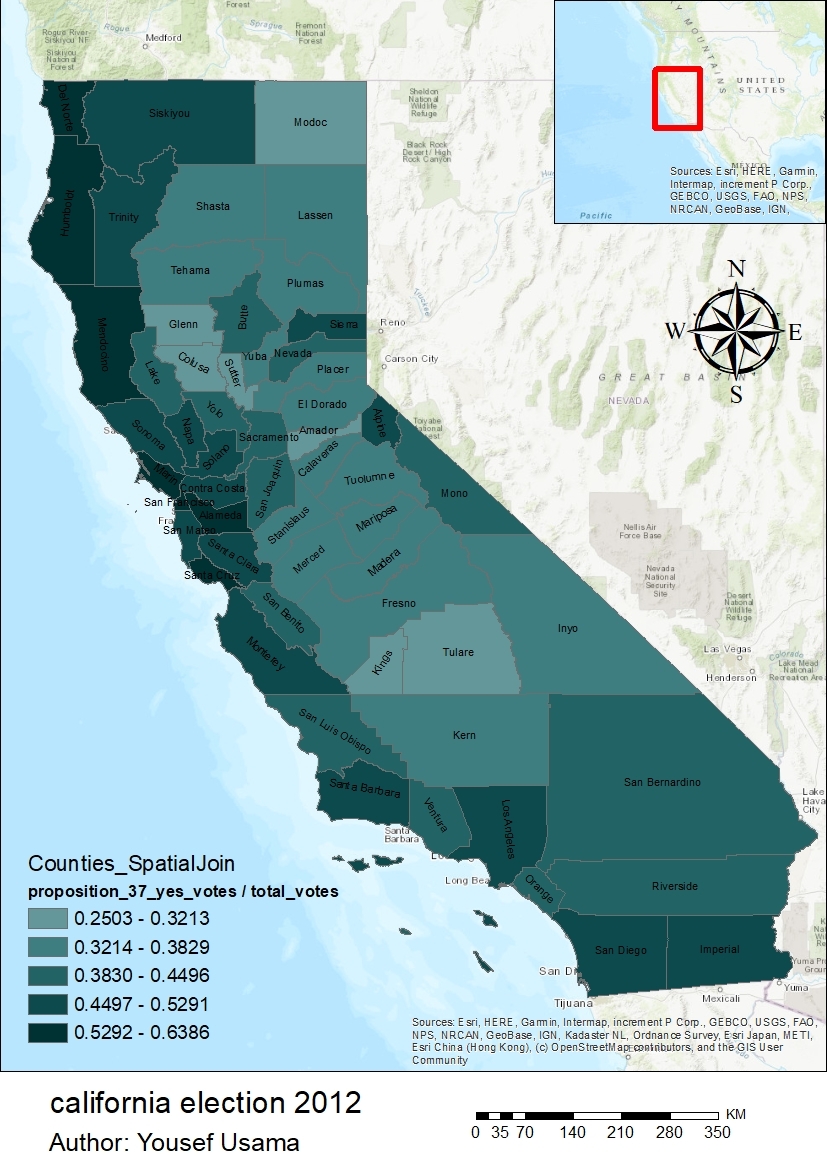
For this project, i participate in a scenario. i am work in the field of electoral politics, and i am specifically interested in ballot measures, where citizens vote directly to enact new laws. i am a GIS analyst for a nongovernmental organization that supported California’s 2012 ballot measure that would have required labeling of genetically modified organisms (GMOs) in food. my task is to look at the broad voting patterns in California on this issue, knowing that the initiative did not gain enough votes to pass.
Tasks
An agency partner in California has provided me with precinct level voting data – polygons matching the actual voting locations in the state.
i have been tasked with aggregating this precinct information up to the county level polygons – which my agency partner has also provided me in a file geodatabase.
steps
- Load the data into a new map document
- Add a basemap
- Conduct your analysis and aggregate the precinct total votes and yes vote data up to the county level
- Symbolize the counties by yes vote data, normalized by total votes. You can choose any color ramp you like, but use just 5 classes and use the default classification method of Natural Breaks (Jenks) in order to have your map be comparable
- Make an appropriate map layout with: a title, a legend with information about the symbol classes (just the range of votes in each is fine), a list of data sources, my name, a scale bar, a north arrow, basemap for reference. Additionally, the counties should be labeled with their names
- Export a PDF of the map’s layout and a map package of the map What you need to submit You will submit the PDF and map package here on Coursera during the peer review phase. You will be graded on each item.