

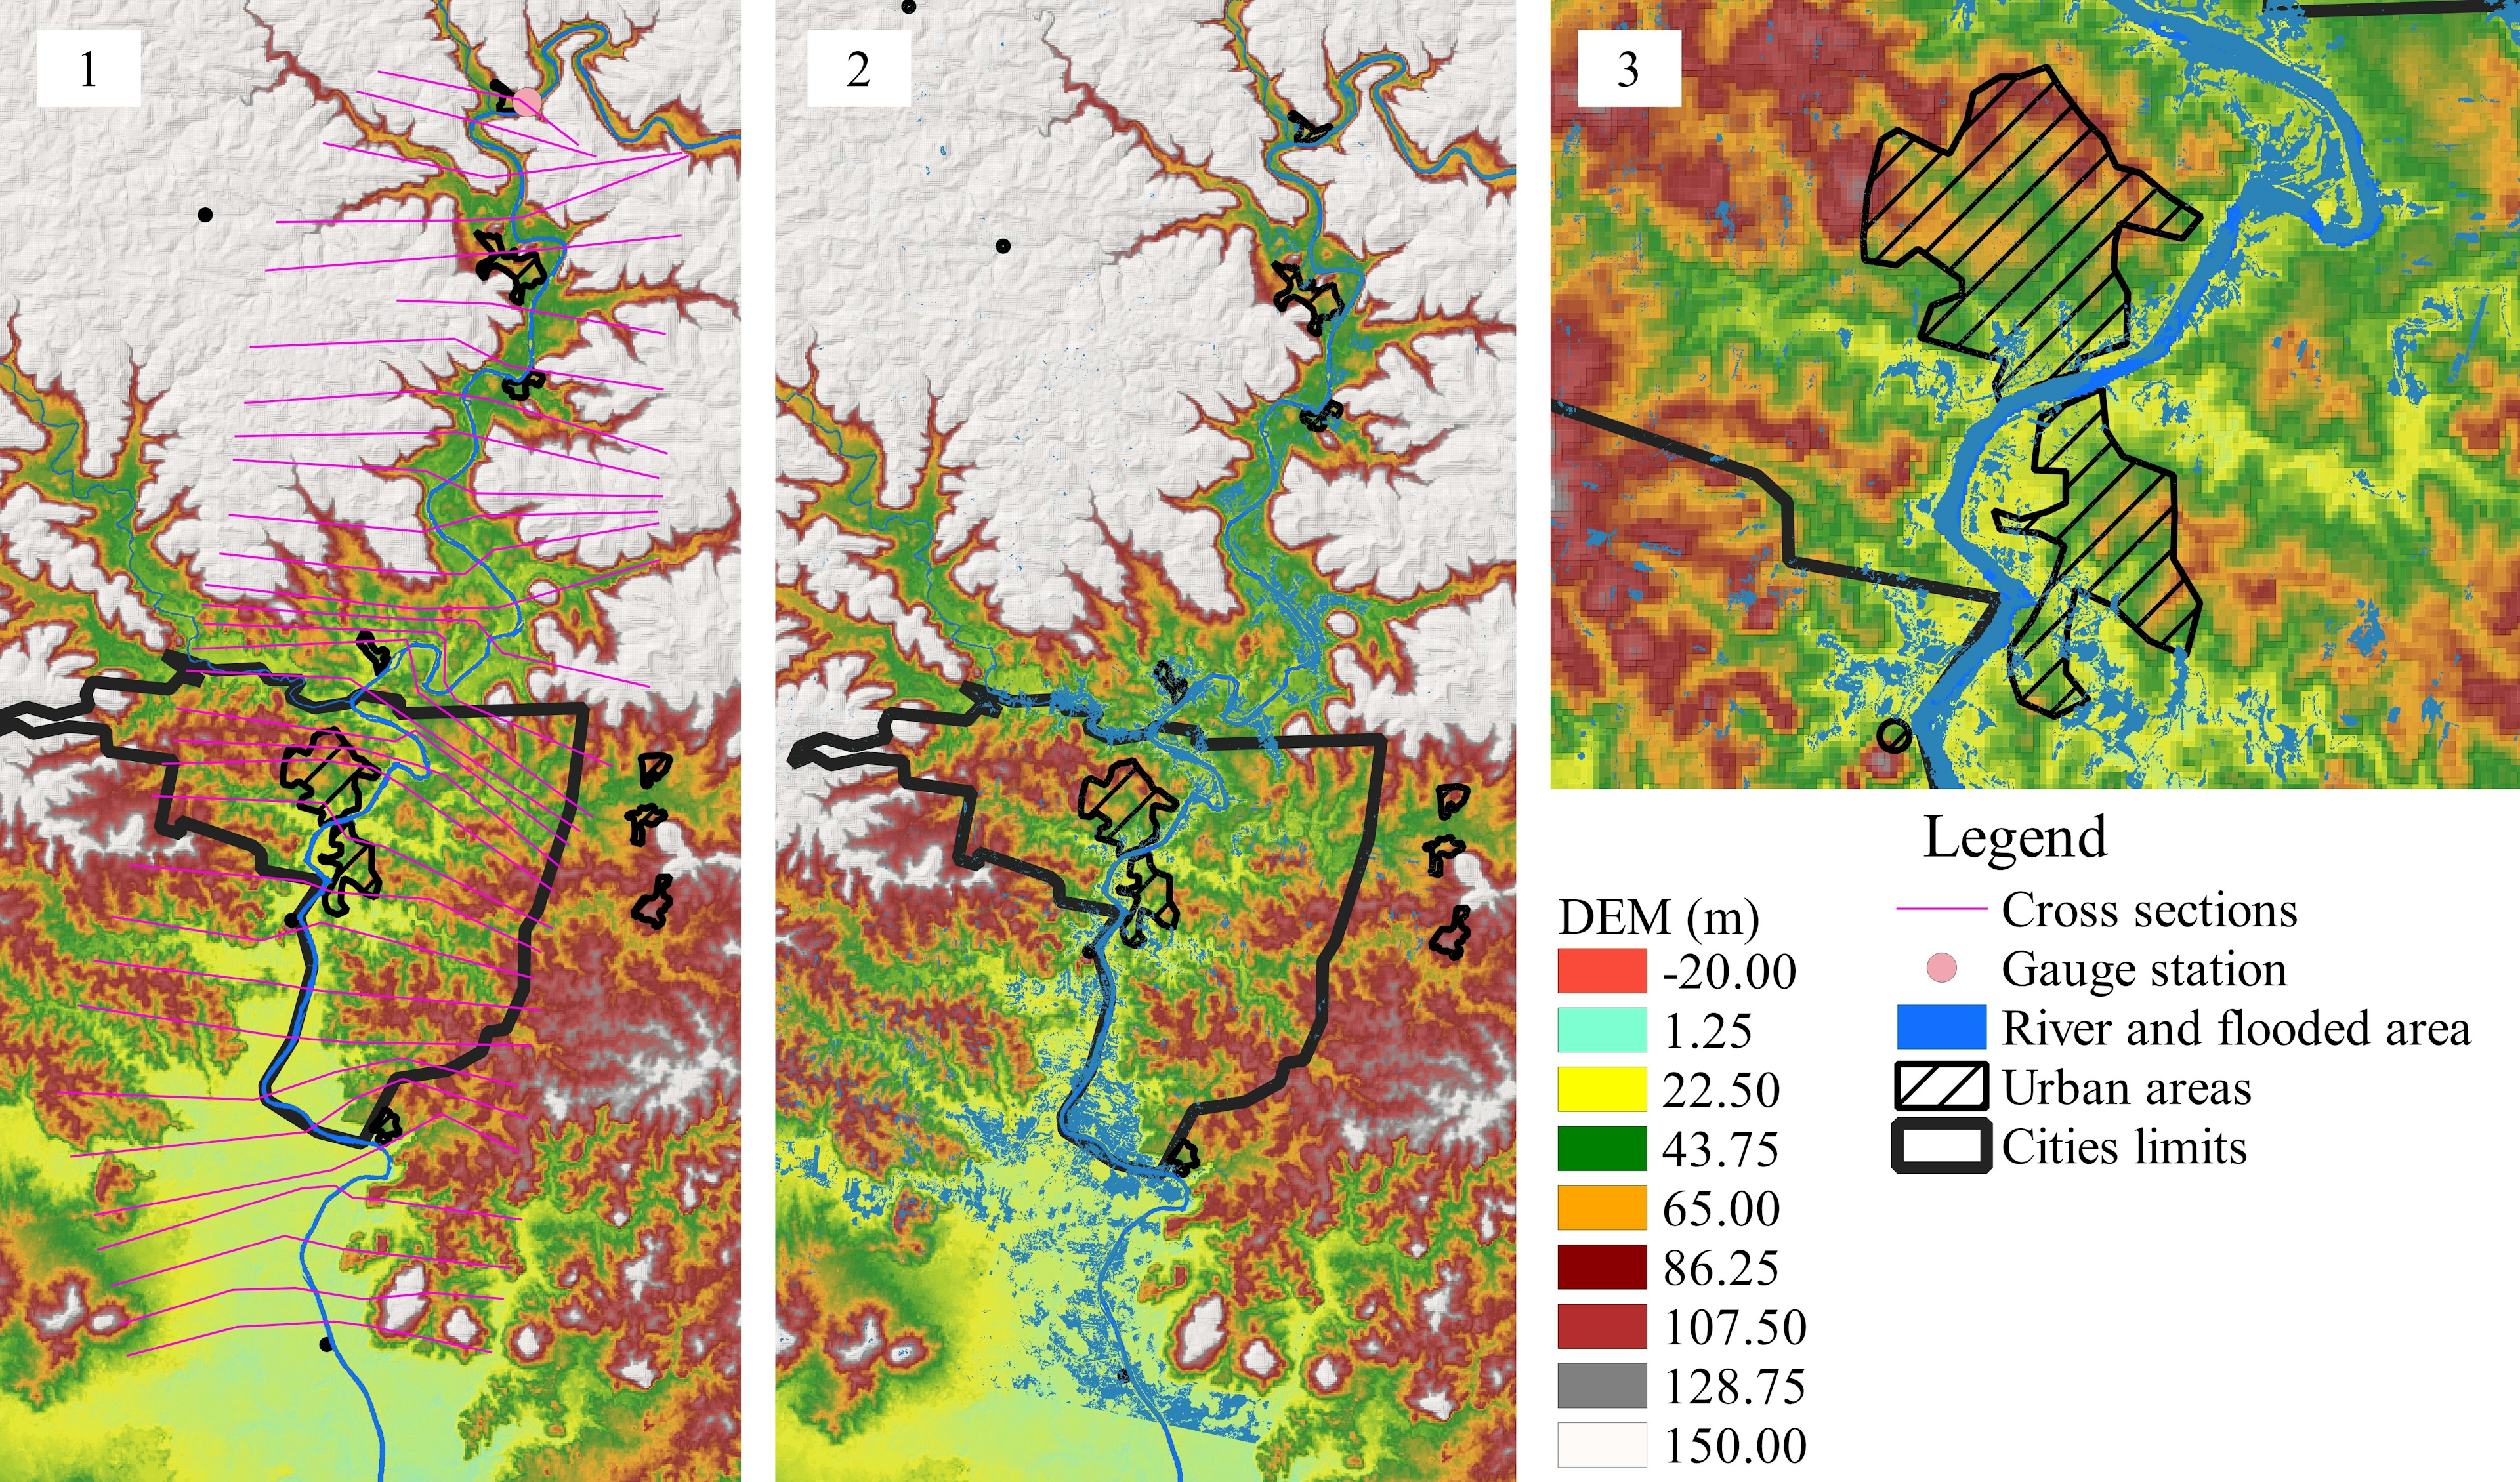
Pixel by pixel comparison between observed and predicted flood extents using HEC-RAS. The three methods used were no-channel method for the river channel, geomorphological relations and Manning equation. Using a 2x2 contingency table, the results are presented by these three graphics where red represents the true positive - predicted and observed wet - and blue represents the true negative - predicted and observed dry. Green and yellow were errors in predictions. Evaluation metrics shows that Manning equation has the best results in general.
Comparing flood extents-hits and errors
Tools used
HECRAS QGIS
tags
floodinundationMAPPING
More by Vinicius Kuchinski

You might also like


Join the community!
We're a place where geospatial professionals showcase their works and discover opportunities.