
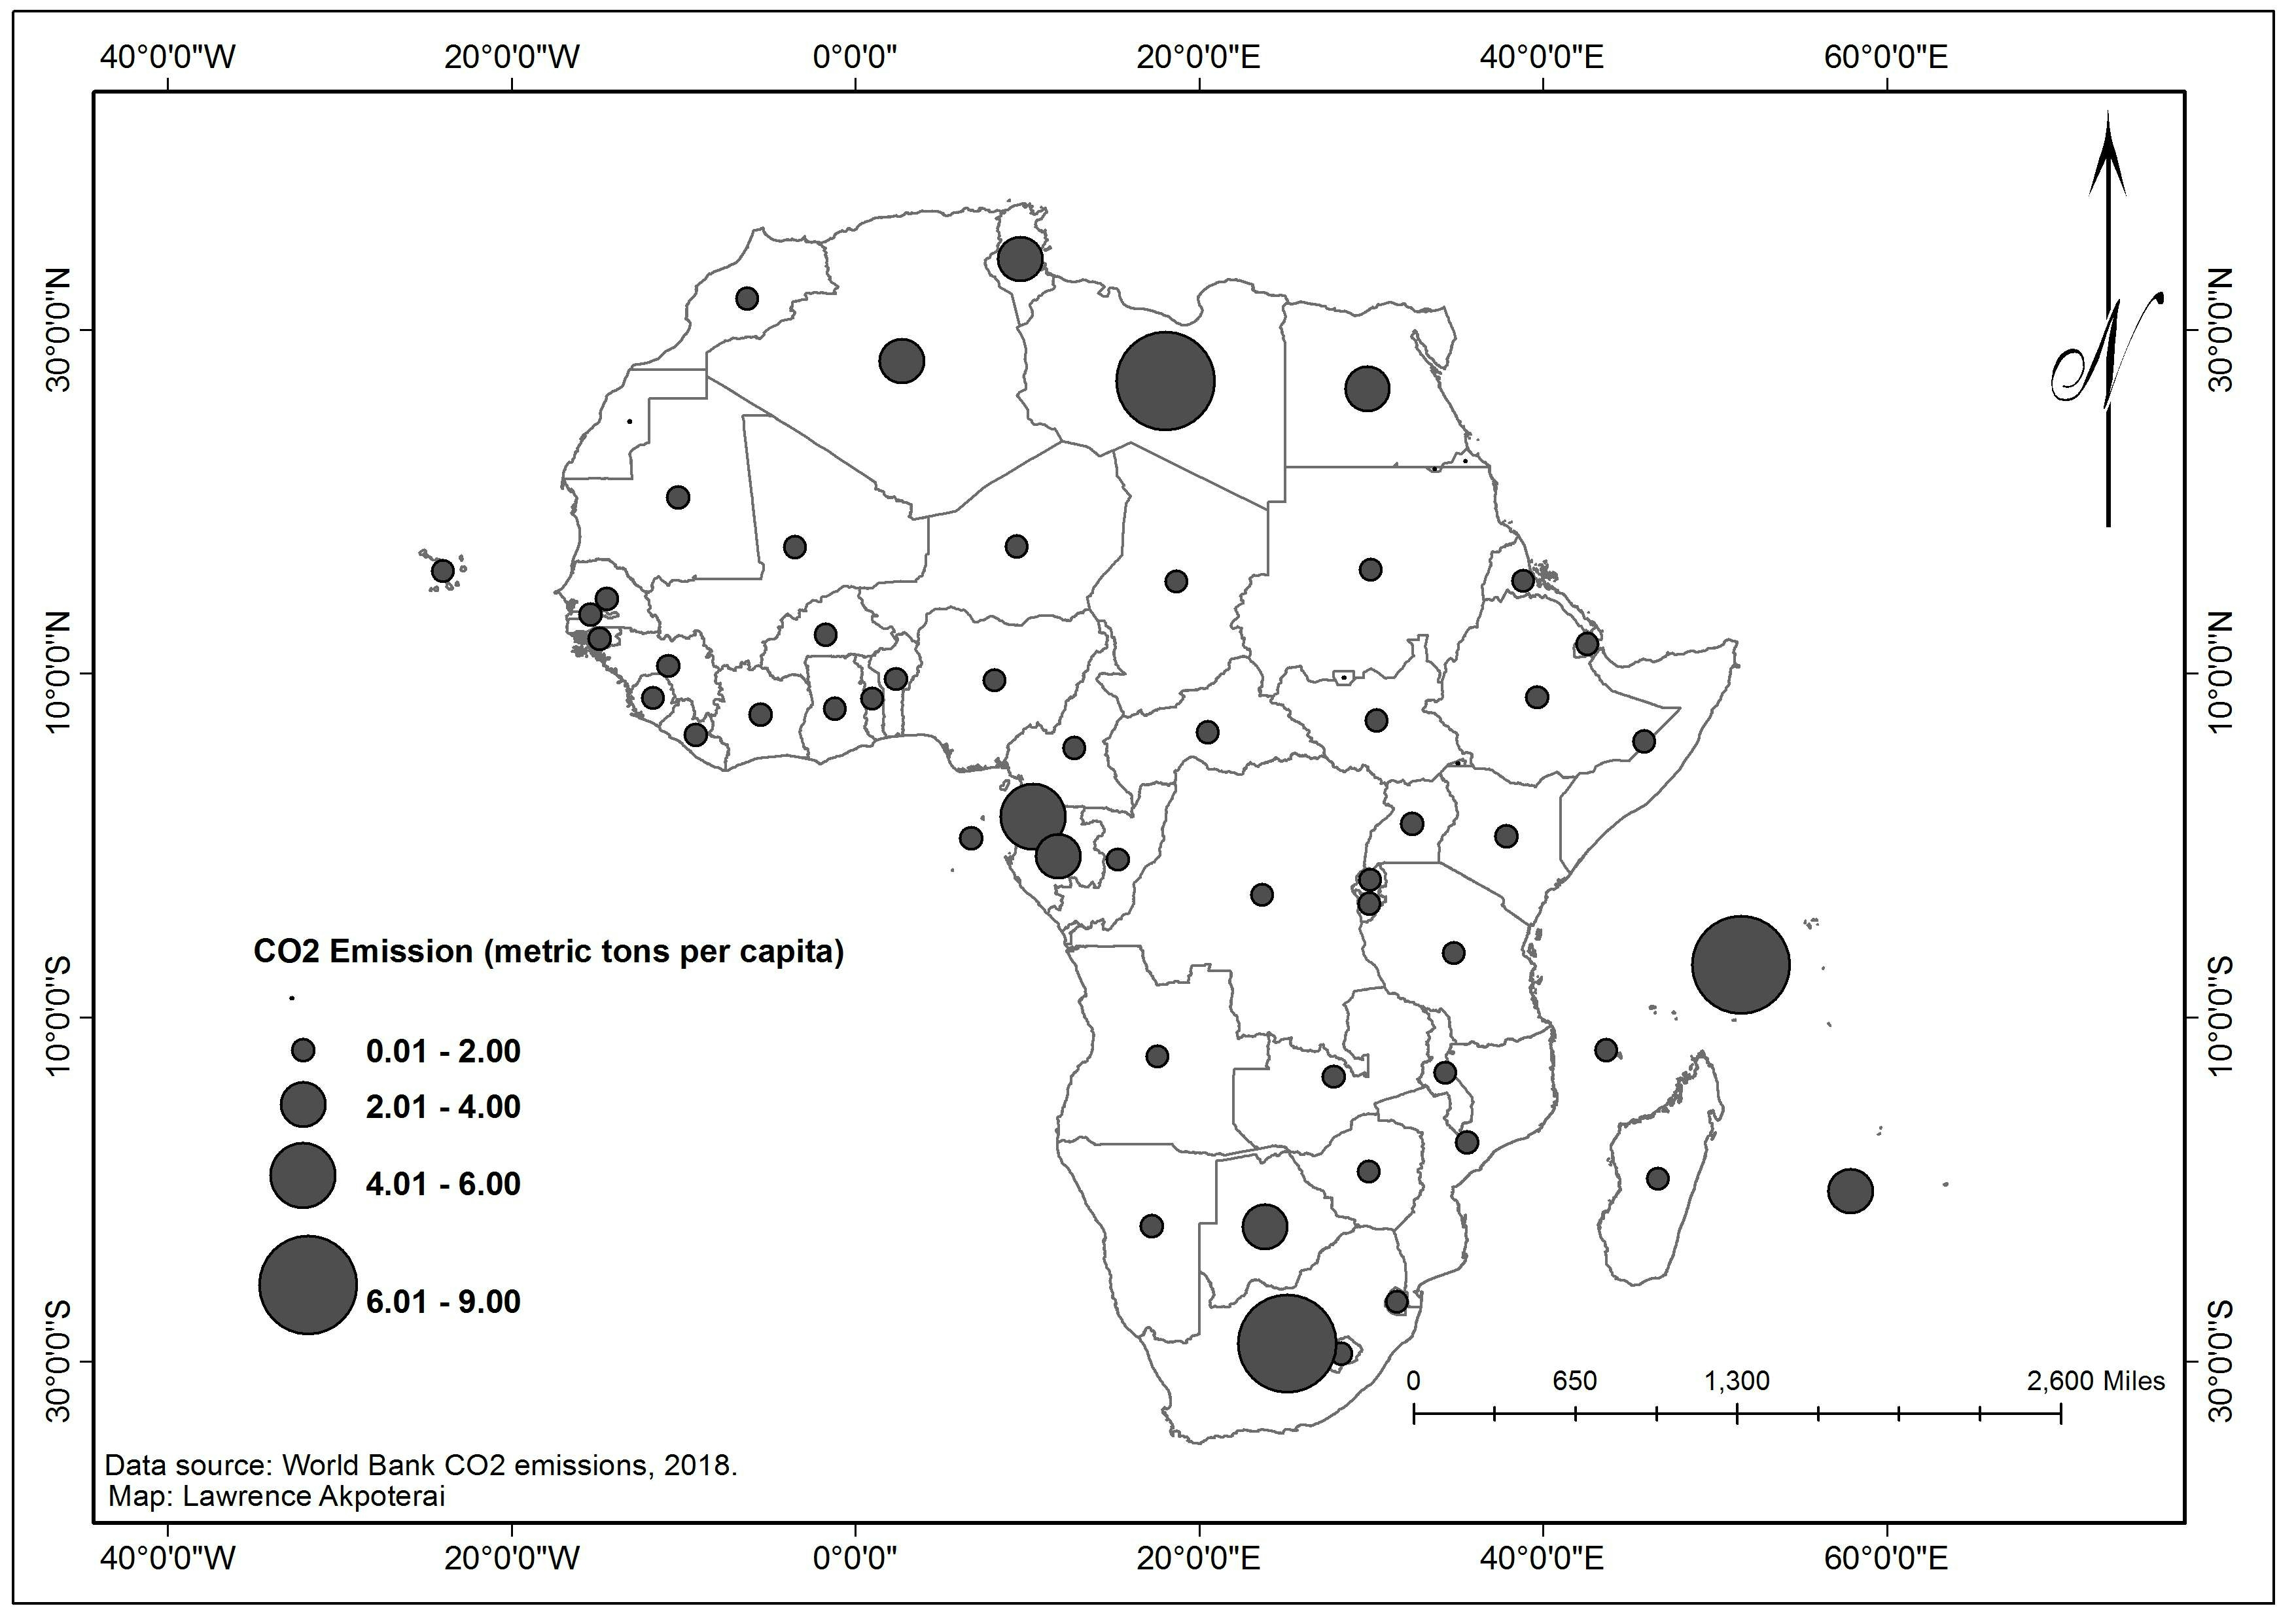
A geospatial illustration using symbology to describe the amount of CO2 emissions across Africa at country level. This is necessary for climate change mitigation plans and low-carbon development efforts.
CO2 Emissions across Africa, 2018
Tools used
ArcMap
Plug-ins used
ArcMap
tags
GeospatialGIS
More by Lawrence Akpoterai
_7771518.jpg&w=3840&q=100)

You might also like


.svg "Keran Nkongolo")


Join the community!
We're a place where geospatial professionals showcase their works and discover opportunities.