
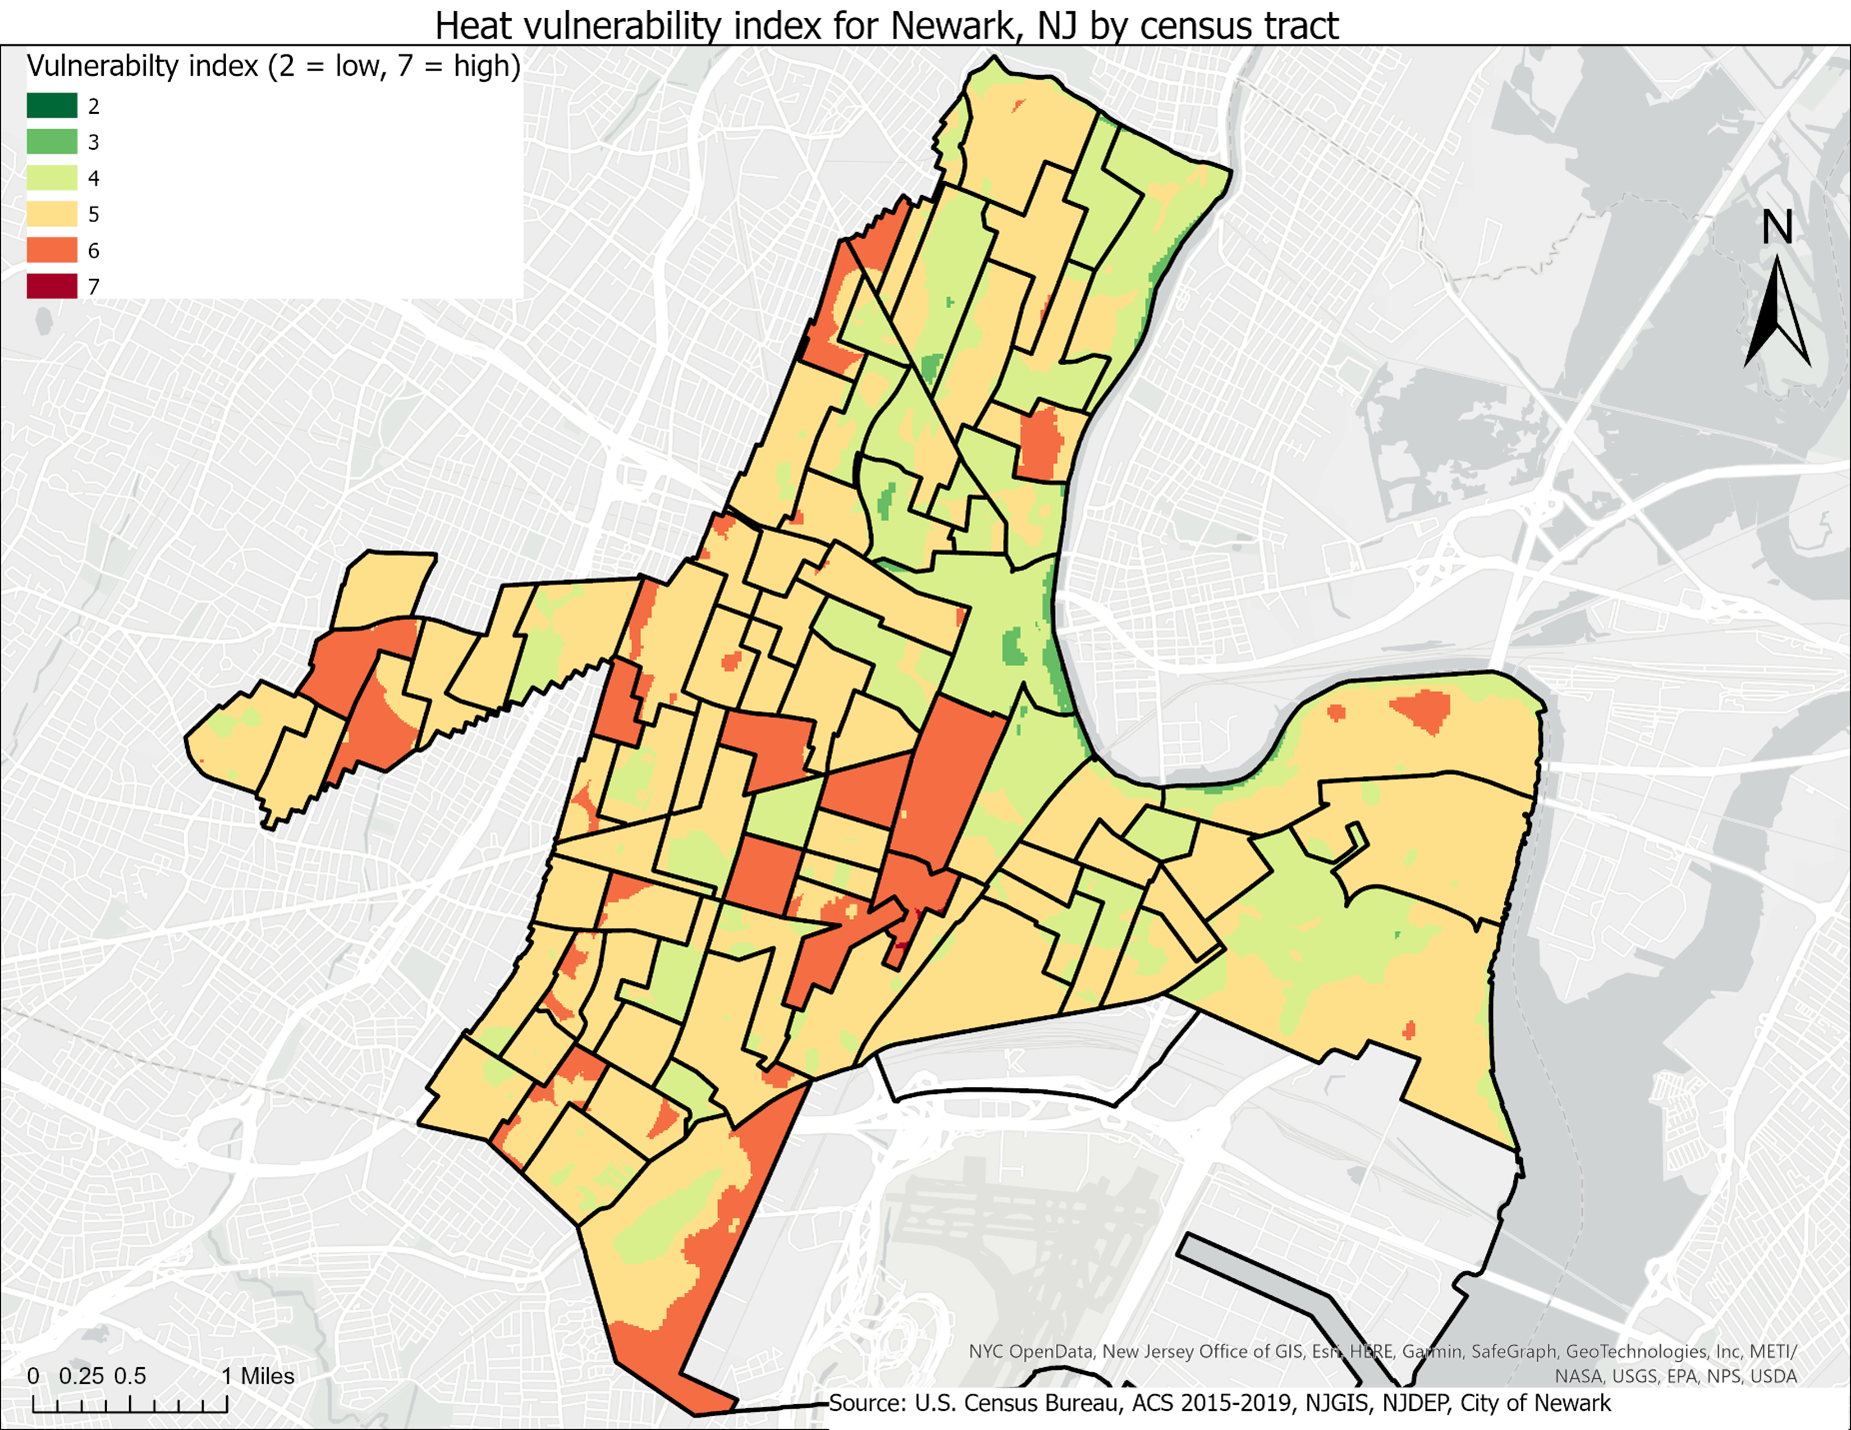
This project involved using five indicators of heat vulnerability: land temperature, senior population, distance to green space, distance to cooling centers, and energy burden to visualize which areas of Newark NJ are more vulnerable to high temperatures.
Heat Vulnerability Index mapping, Newark
Plug-ins used
ModelBuilderraster calculator
tags
environmental justiceNew JerseyUrban Heat Island
You might also like
.png&w=3840&q=100)


.svg "Keran Nkongolo")


Join the community!
We're a place where geospatial professionals showcase their works and discover opportunities.