For this project I was provided with a database of wildlife animal sightings at 3 camera locations.
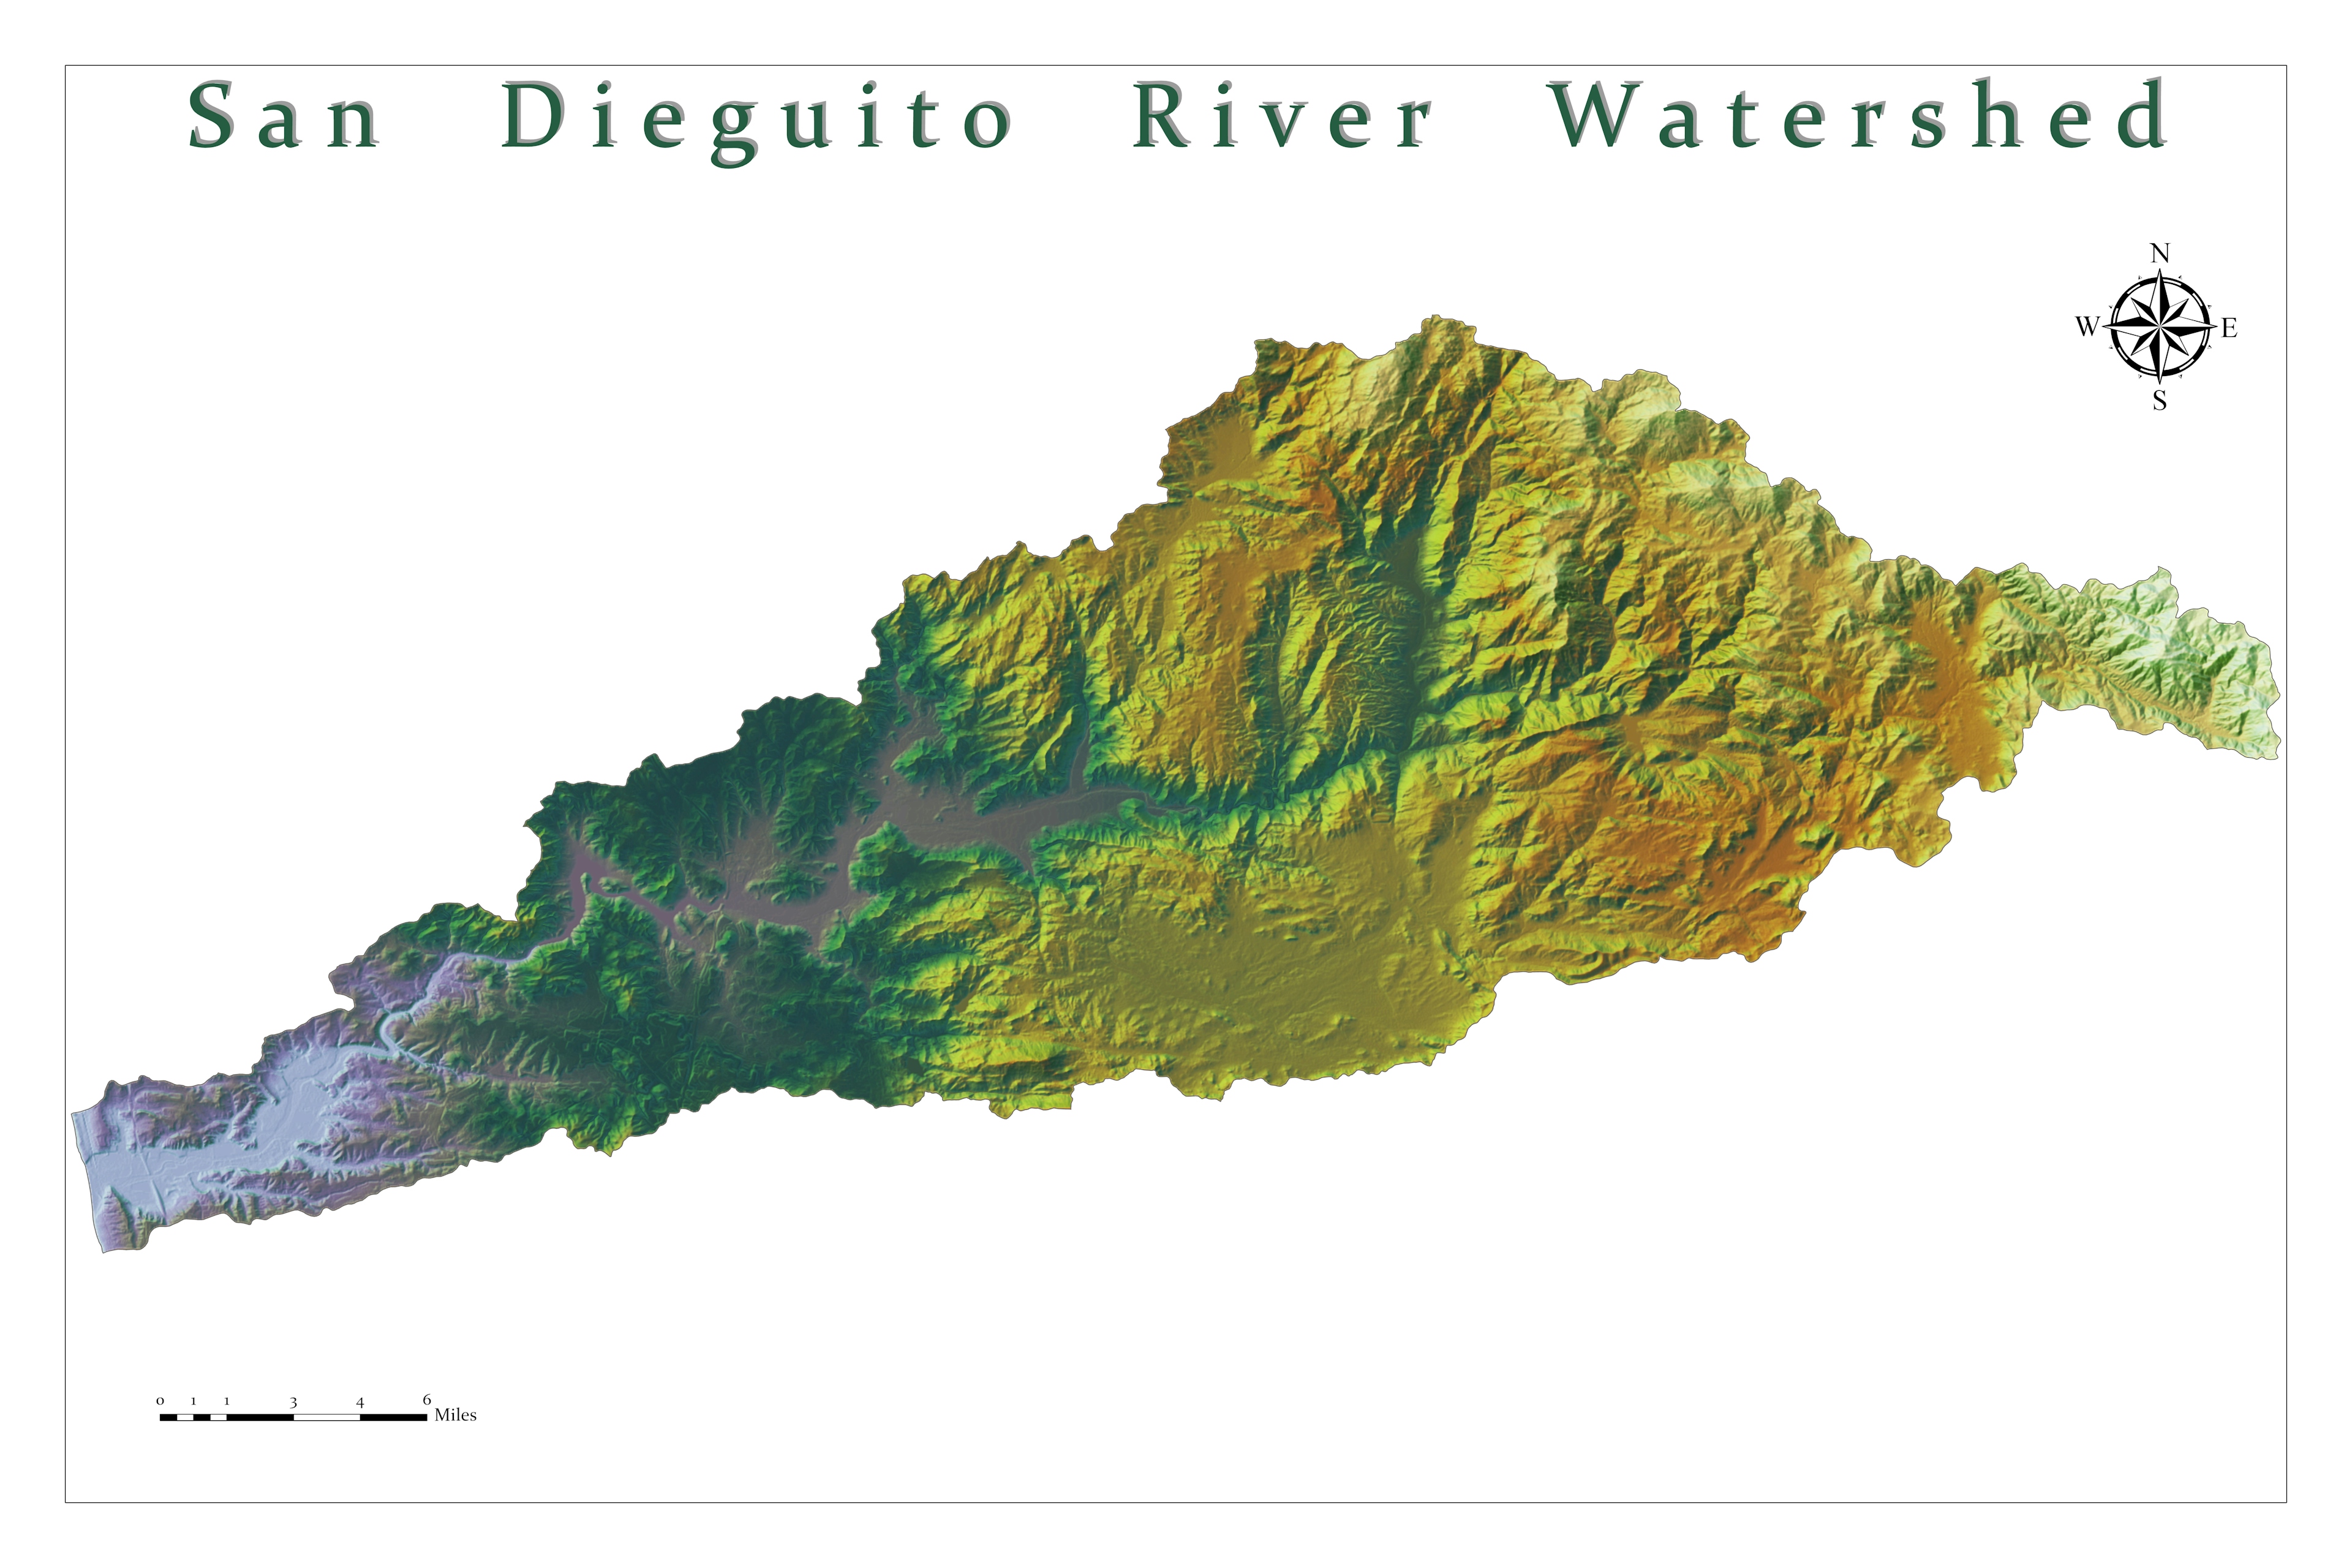
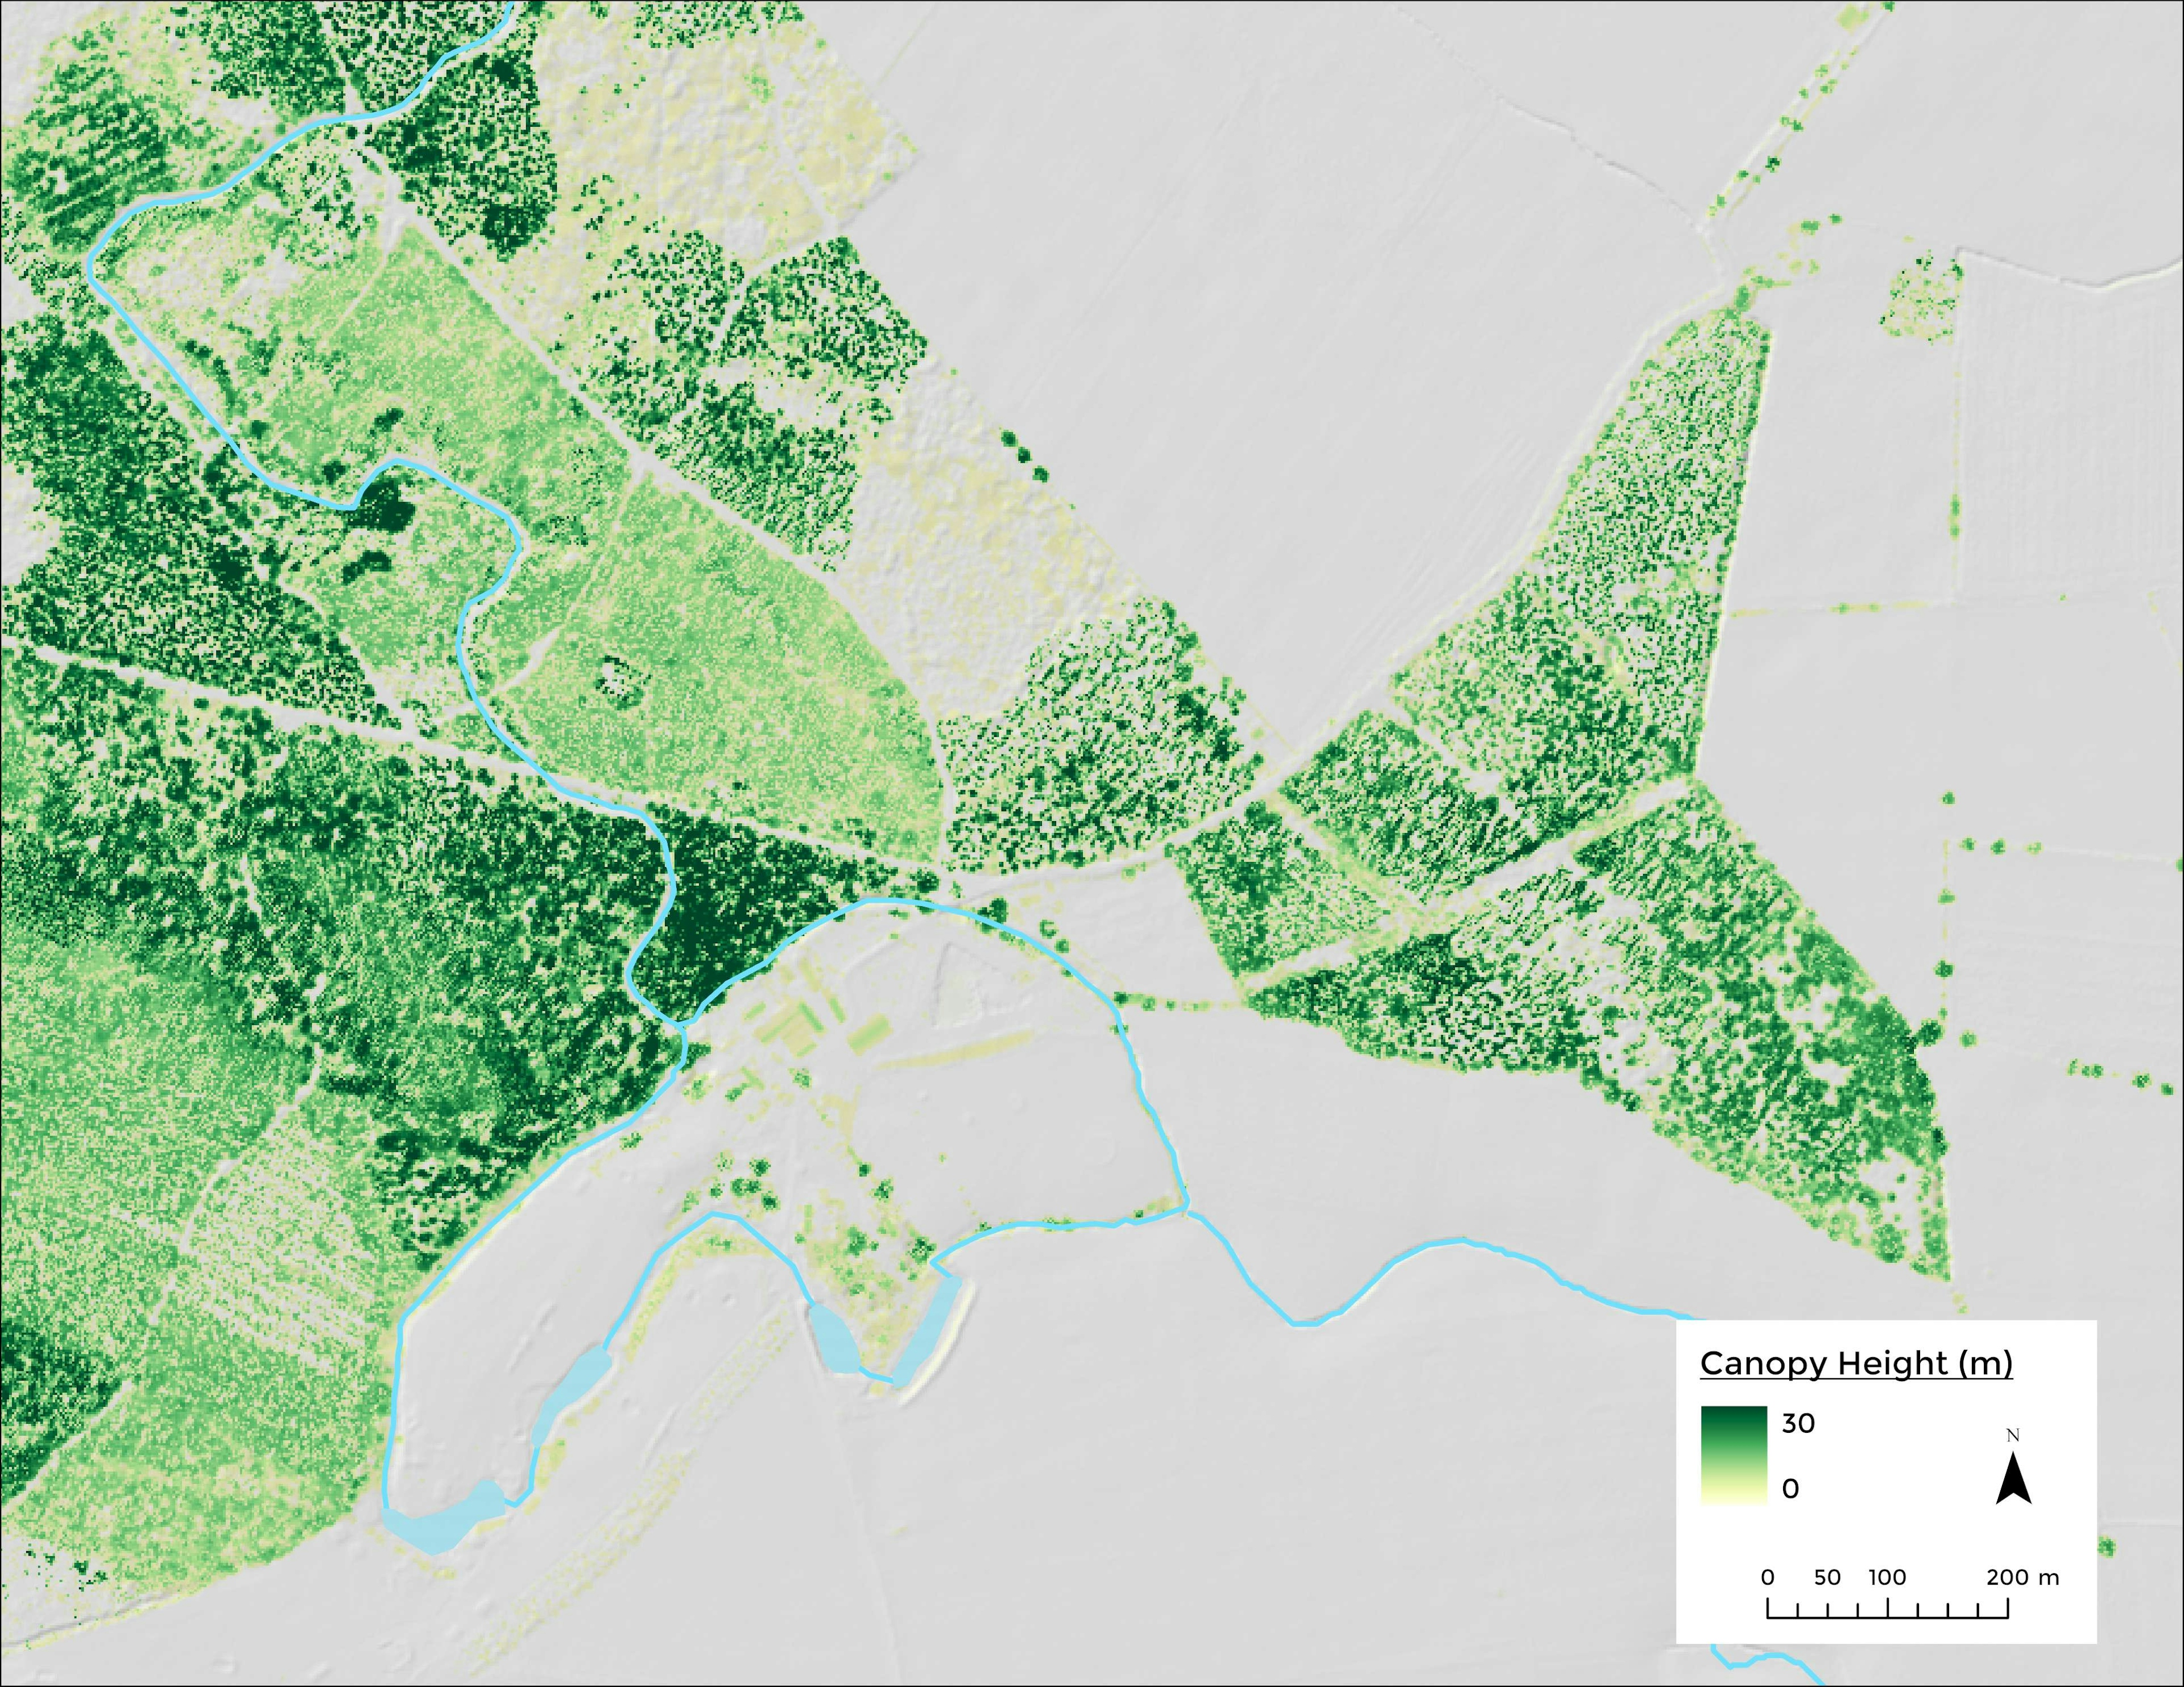
First of all, I downloaded Lidar data to create a raster surface, and I mapped the location of cameras (this part has not been uploaded online).
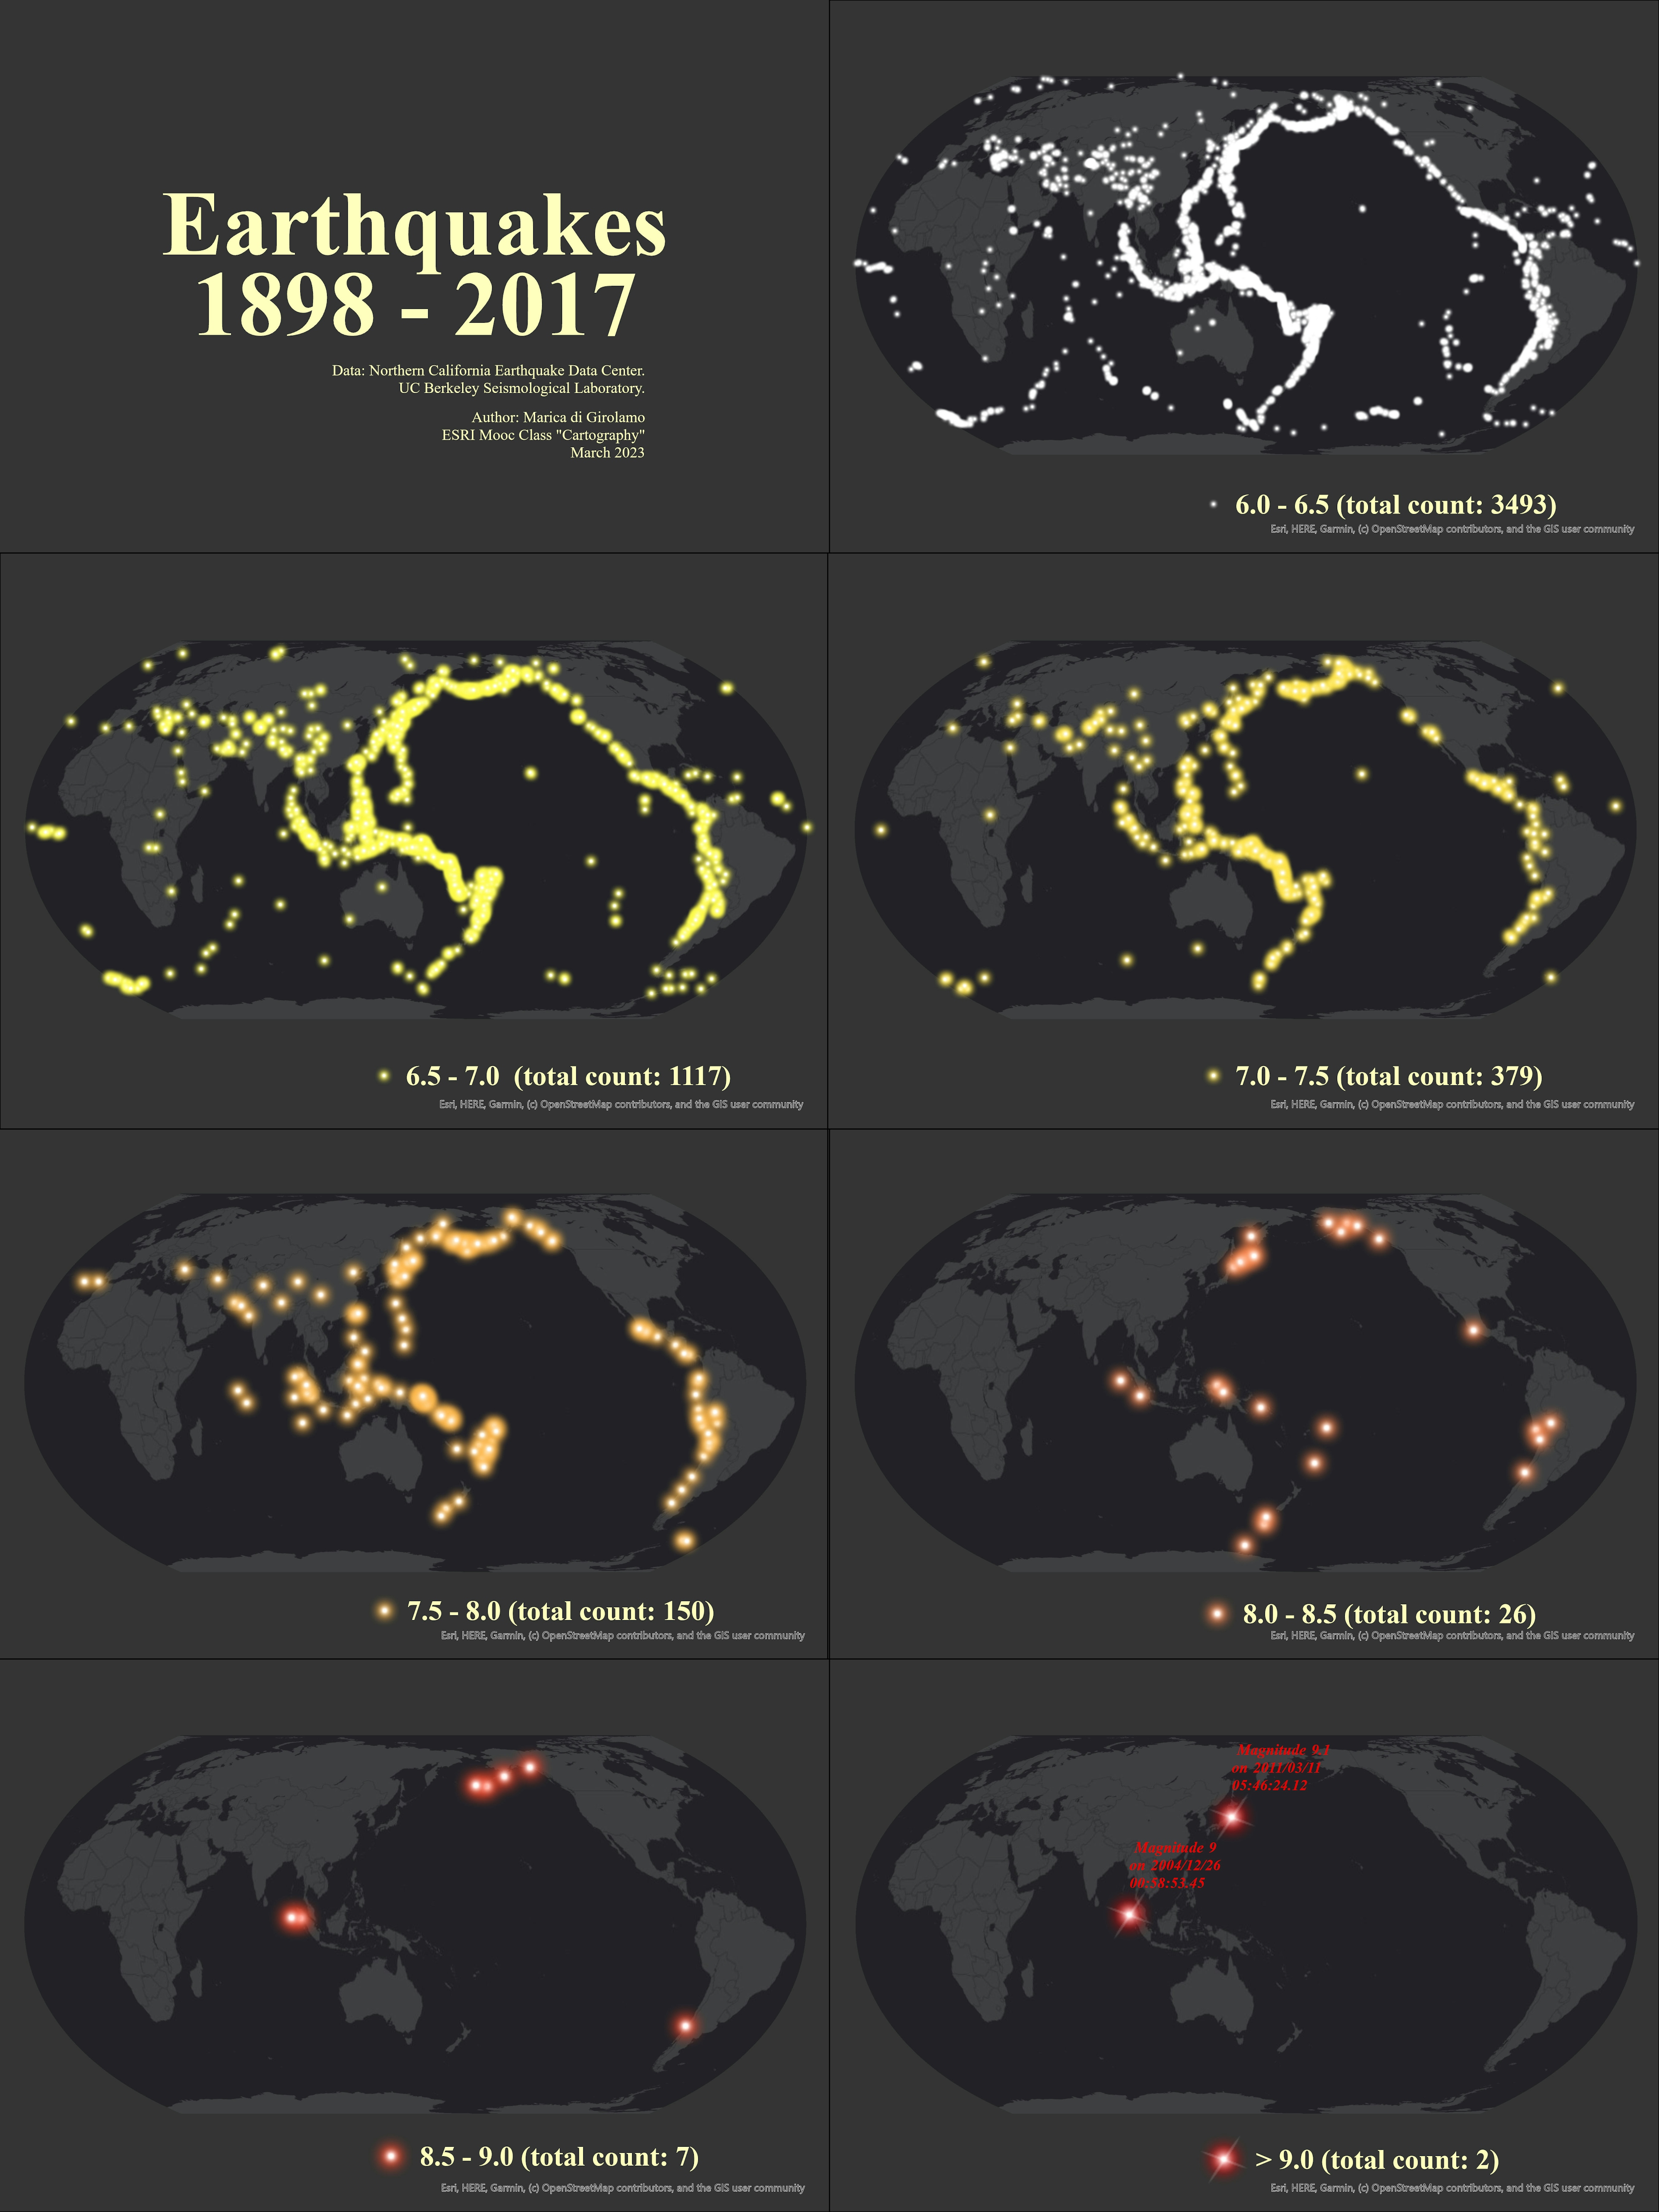
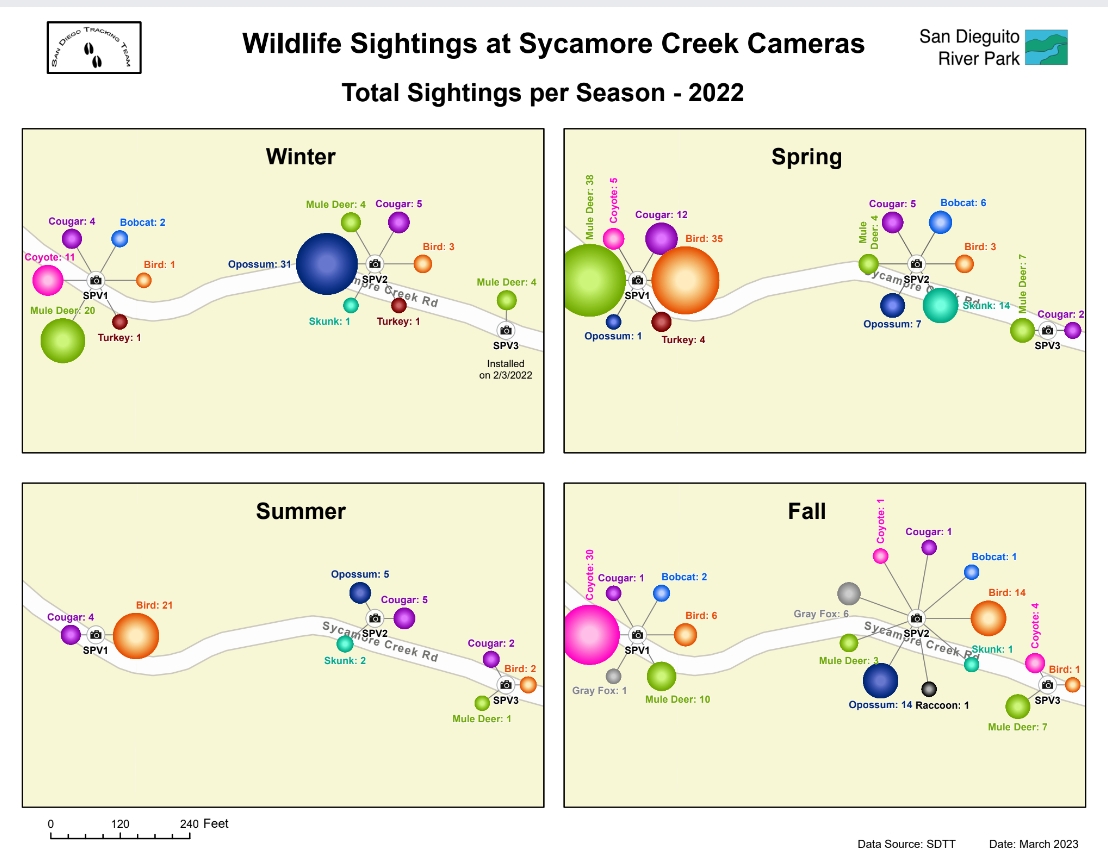
Then I was presented with the challenge of displaying a large amount of data (total sightings of different species) in only three locations (wildlife cameras).
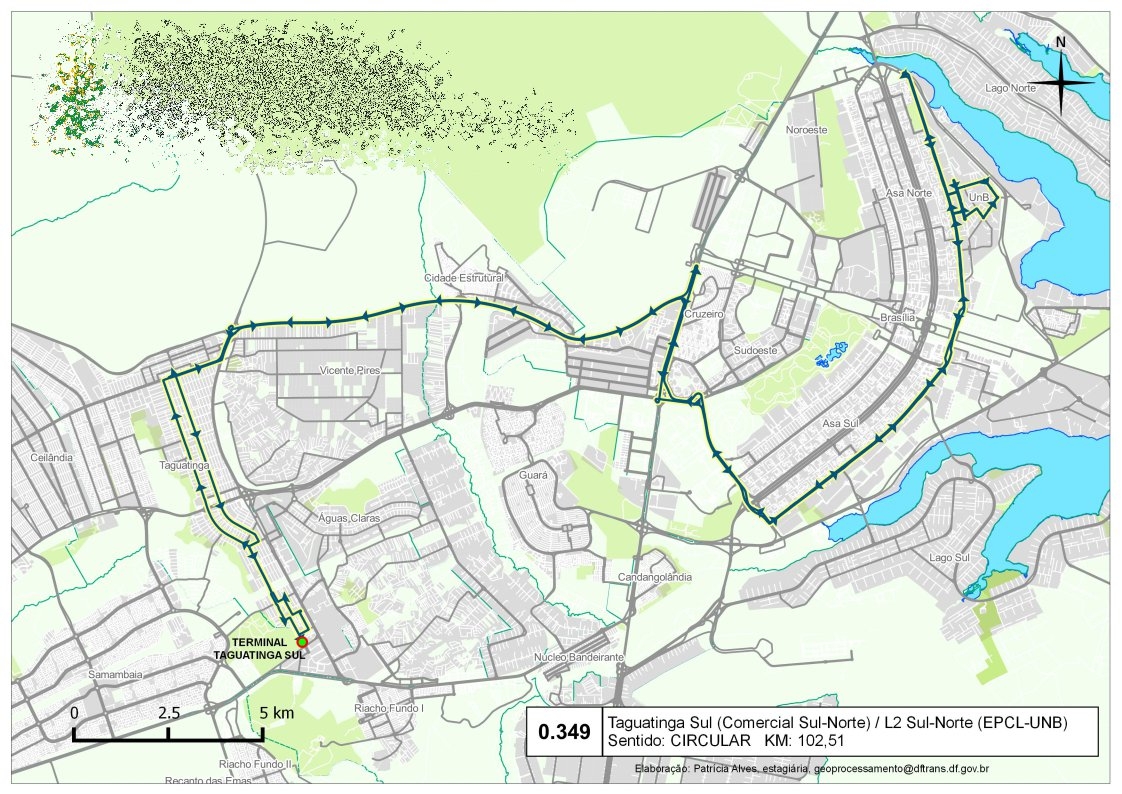
It was agreed to create a set of smaller maps, each one of them displaying the total number of sightings per species per season per year. I dispersed the data around each camera location, and used proportional symbols in different colors.
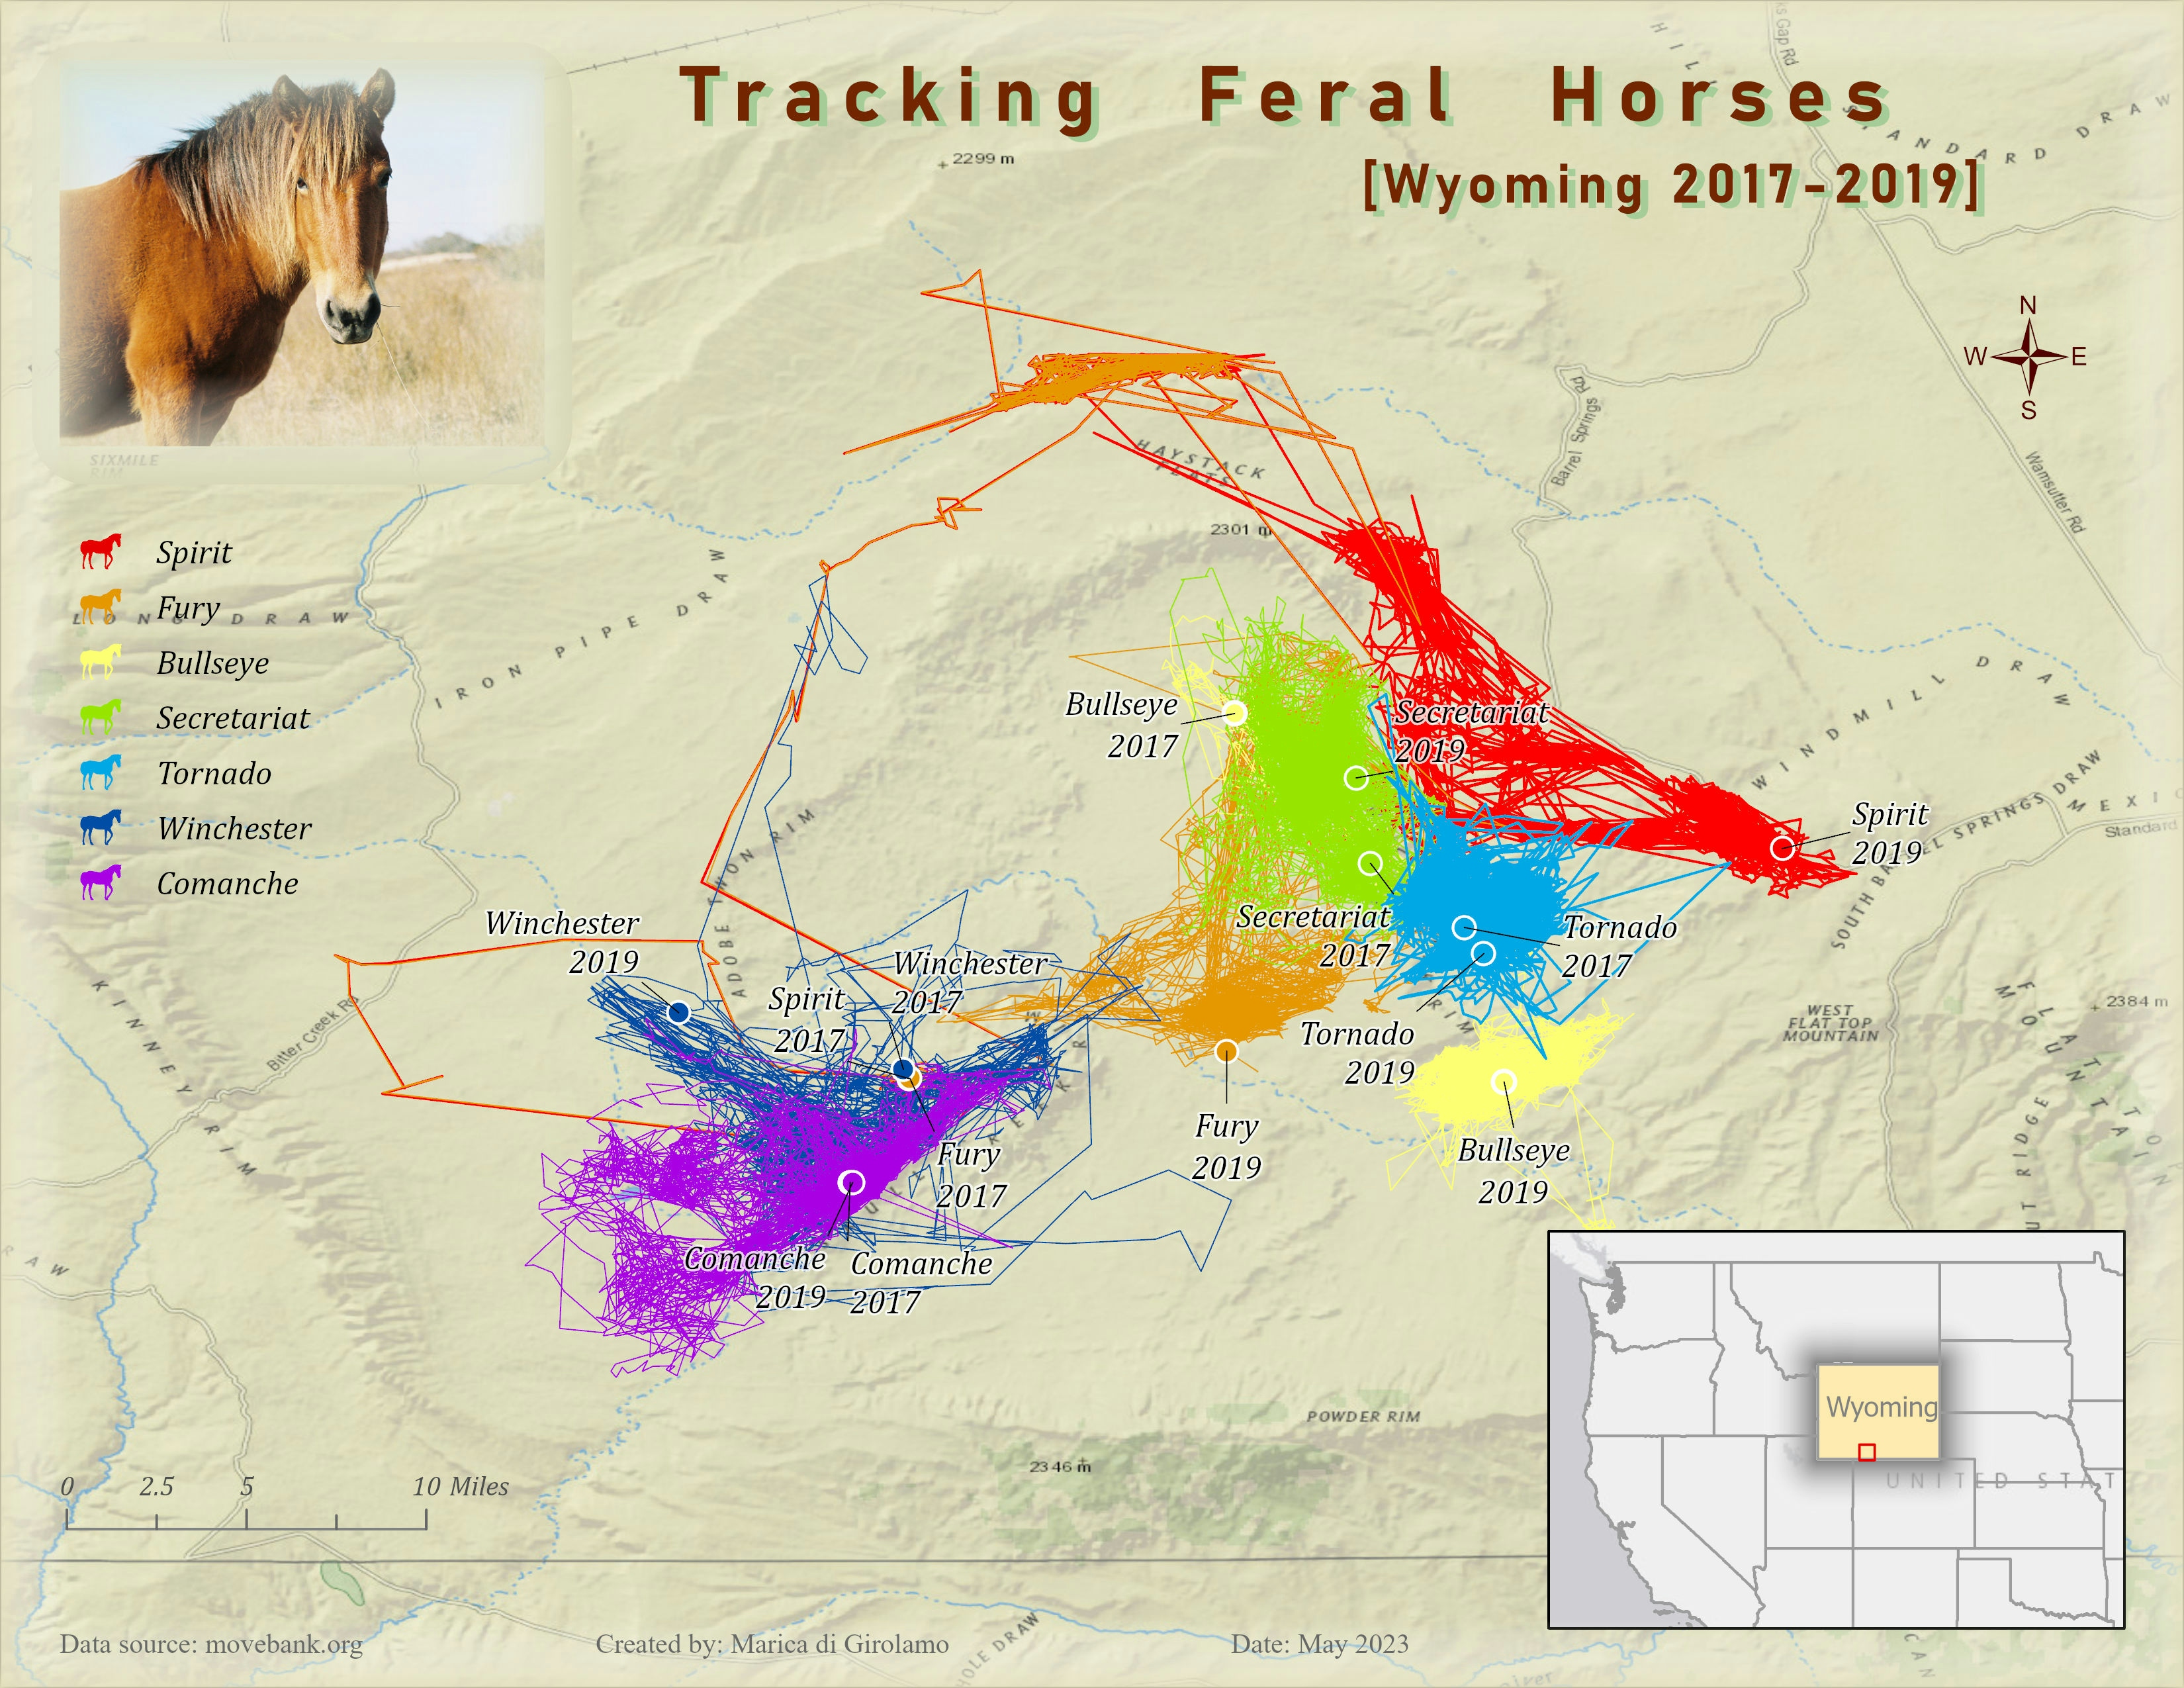
Subsequently, the direction of movement for 4 main species was analyzed and displayed.