
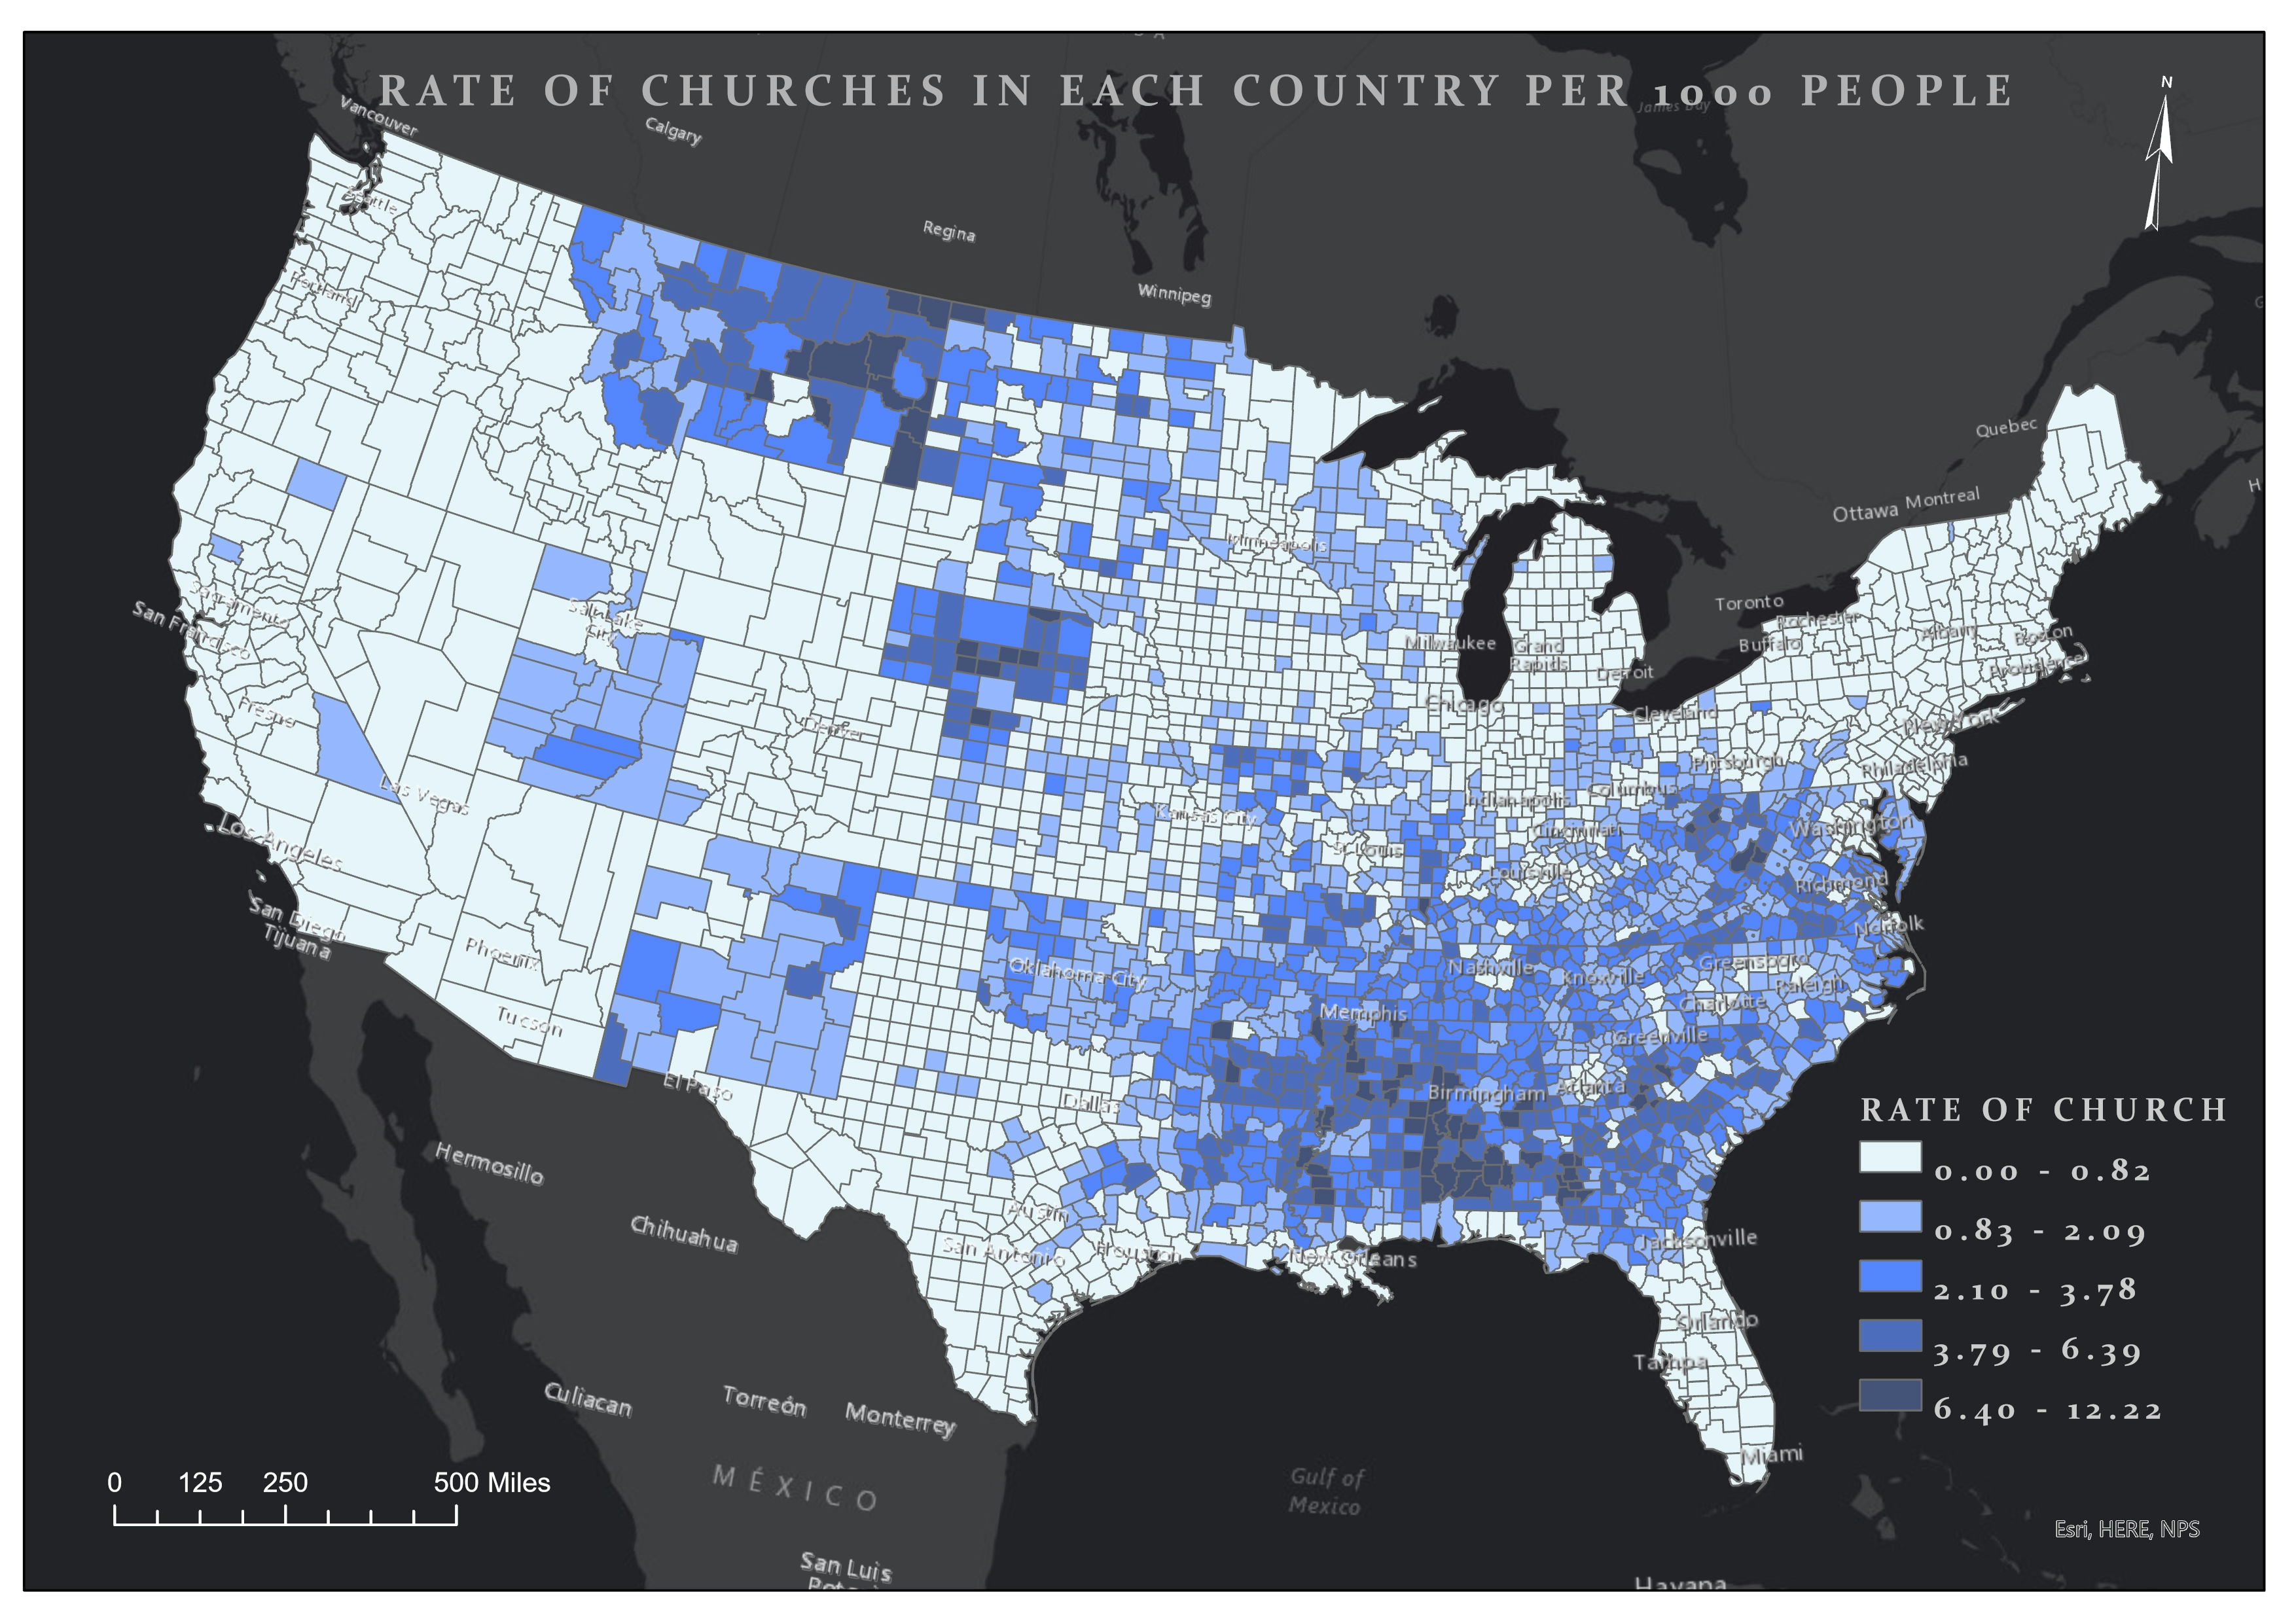
When we examine the county as a whole, the pattern appears to be random. However, there are noticeable clusters or hotspots of churches in the southeast portion of the country, indicating a positive autocorrelation. In contrast, the western portion shows little to no clustering.
Distribution of Churches in U.S.
Tools used
ArcGIS Pro
Plug-ins used
Geostatistical Analyst ToolsSpatial Analyst Toolbox
tags
AutocorrelationDistributionGeostatisticRate
More by Niroj Shrestha
You might also like


Join the community!
We're a place where geospatial professionals showcase their works and discover opportunities.