Historically, the business had to rely on only historical information as the source of electric grid network status. Determining the current network status required telephone/radio calls placed to technical personnel or a cumbersome process to query the status of specific meters attached to the field element, one at a time. With the deployment of GNMS, a Data Aggregation System (DAS) was used to fetch relevant data from the meter headend systems and present the data to the ArcGIS system via an API. This was achieved with the aid of ArcGIS GeoEvent Server.
Loss Reduction Gains
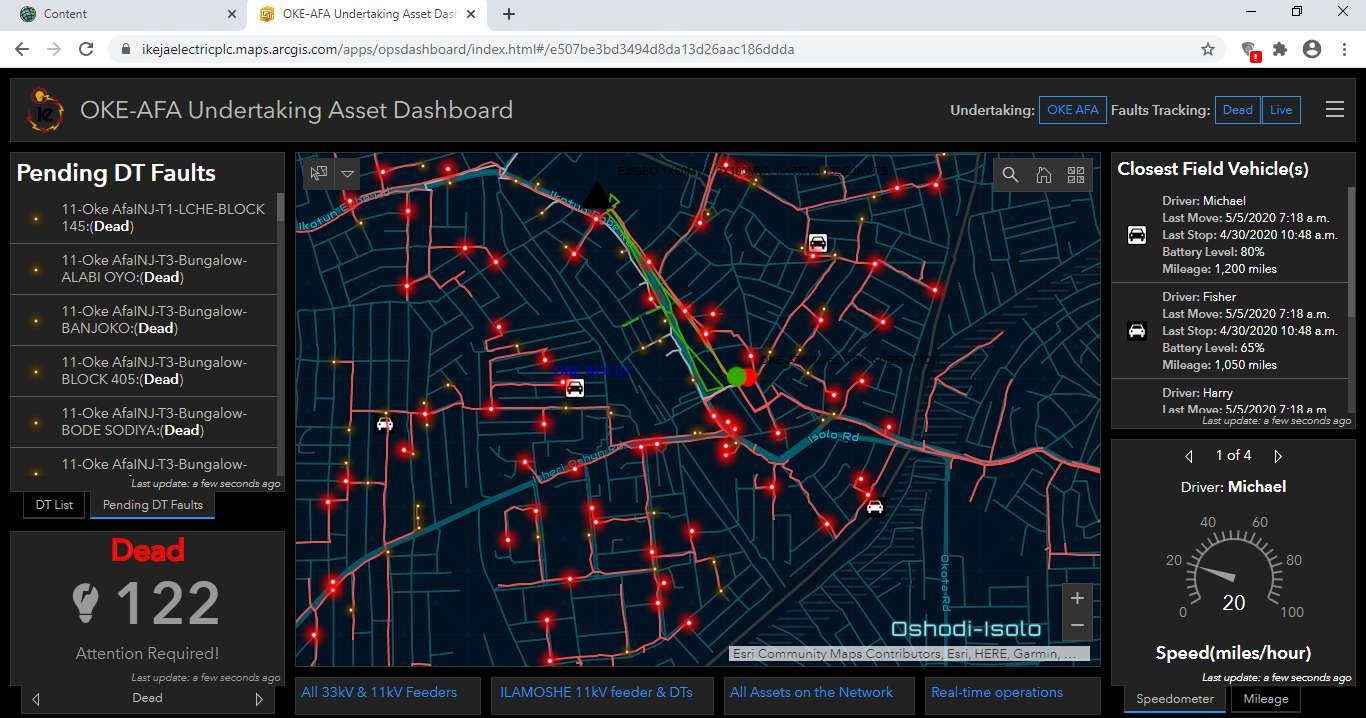
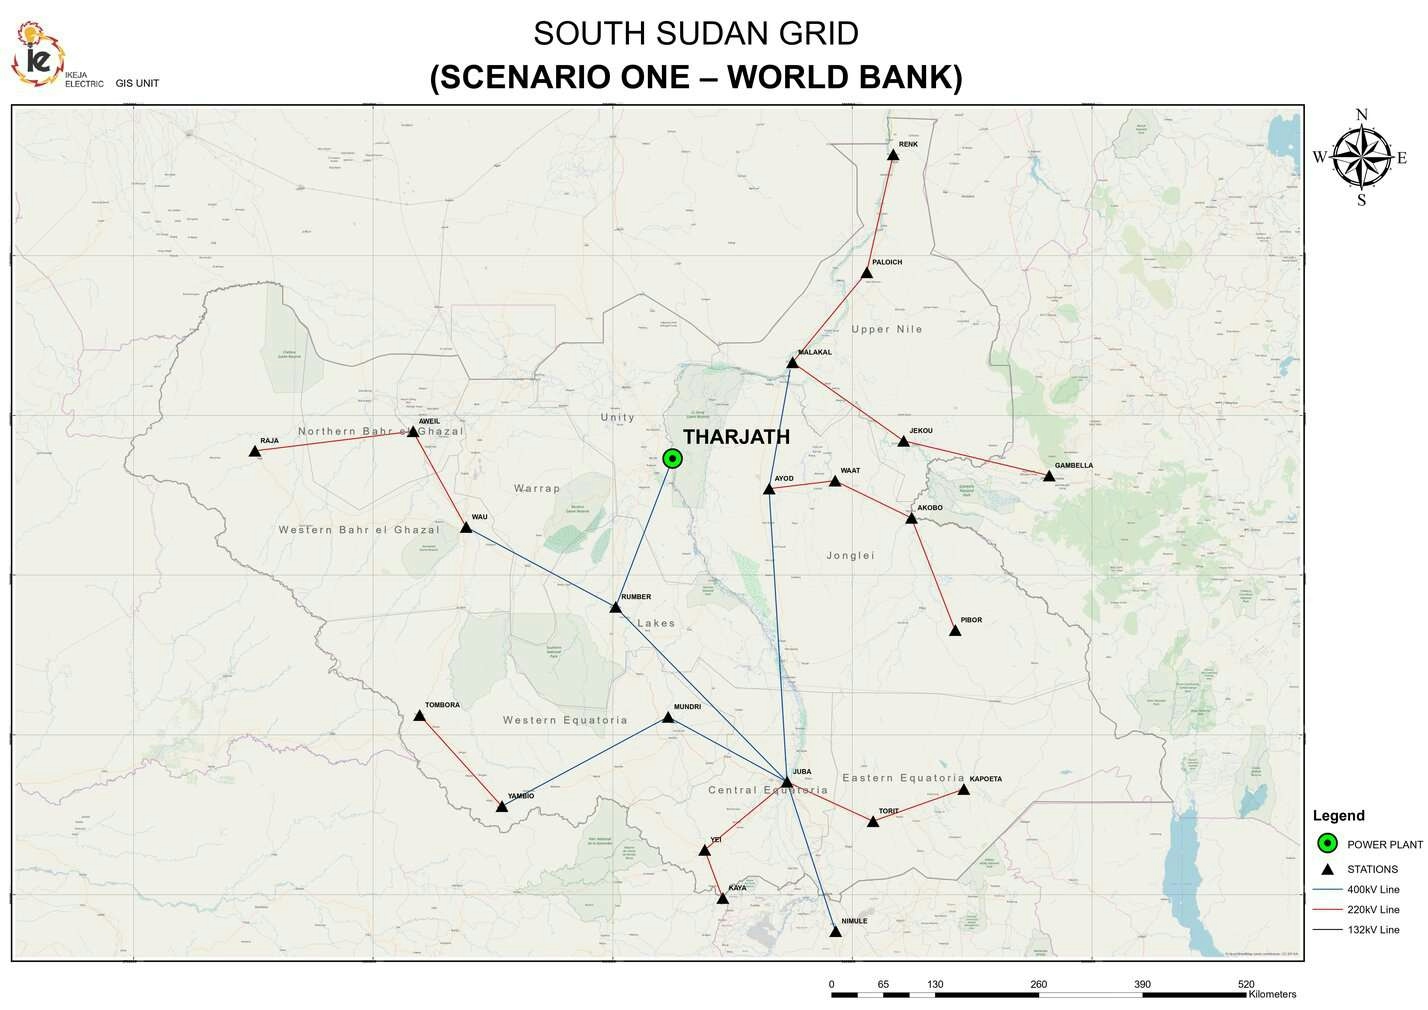
The Geographical Network Management System (GNMS) provided real-time status of power in the different network elements on the Ikeja Electric sub-grid. It incorporated features such as the listing of all distribution substations, Injection substations, feeders, and real-time information of network (substation and feeder) parameters as received from smart remote terminal devices to be deployed within the network at the injection station, feeder, and distribution substation level.
To enable the easy identification of faults, the project also incorporated Remote Terminal Device (RTU) units across all substations in Ikeja Electric (Injection and Distribution substation) to serve as remote sensing devices. These devices provided real-time sensing of parameters guiding the operating conditions of IE assets and provide predictive and prescriptive analysis on IE network condition embedded with GNMS to provide interactive dashboards to access network elements and real-time information as a core value to Ikeja Electric Technical Operations. The average duration of faults in the current system and operation in the Ikeja Electric network is 10 hours. While the system does not particularly prevent fault, it aids to shorten the response time to faults by at least 3 hours.
Overall Benefits to the Business:
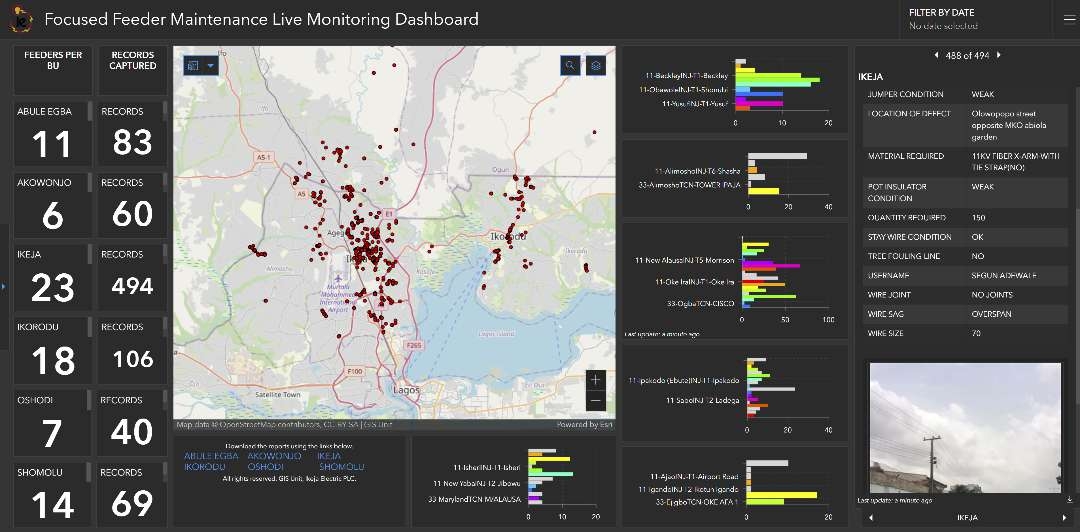
· Maintenance engineers can troubleshoot faults with the information displayed for the 33kV and 11kV feeders on ArcGIS Operational dashboard
· More granular view can be obtained for a selected feeder showing its connected DTs and even the customers under them
· Views can be assigned per Undertaking (UT) to display technical assets and their status at every point in time
· All assets on the network are displayed such that the information can be streamlined according to the requirements of the business.


.jpg&w=3840&q=100)