For this project, an assessment of the accessibility to healthcare for low-income populations in Los Angeles County, California, United States was conducted. Accessibility can be simply defined as the ease, in terms of time and effort, to reach a destination or access a service. This is an important issue in city management as understanding accessibility, or lack thereof, can help identify deficiencies in administration and inform the reallocation of services and resources to better support a population.
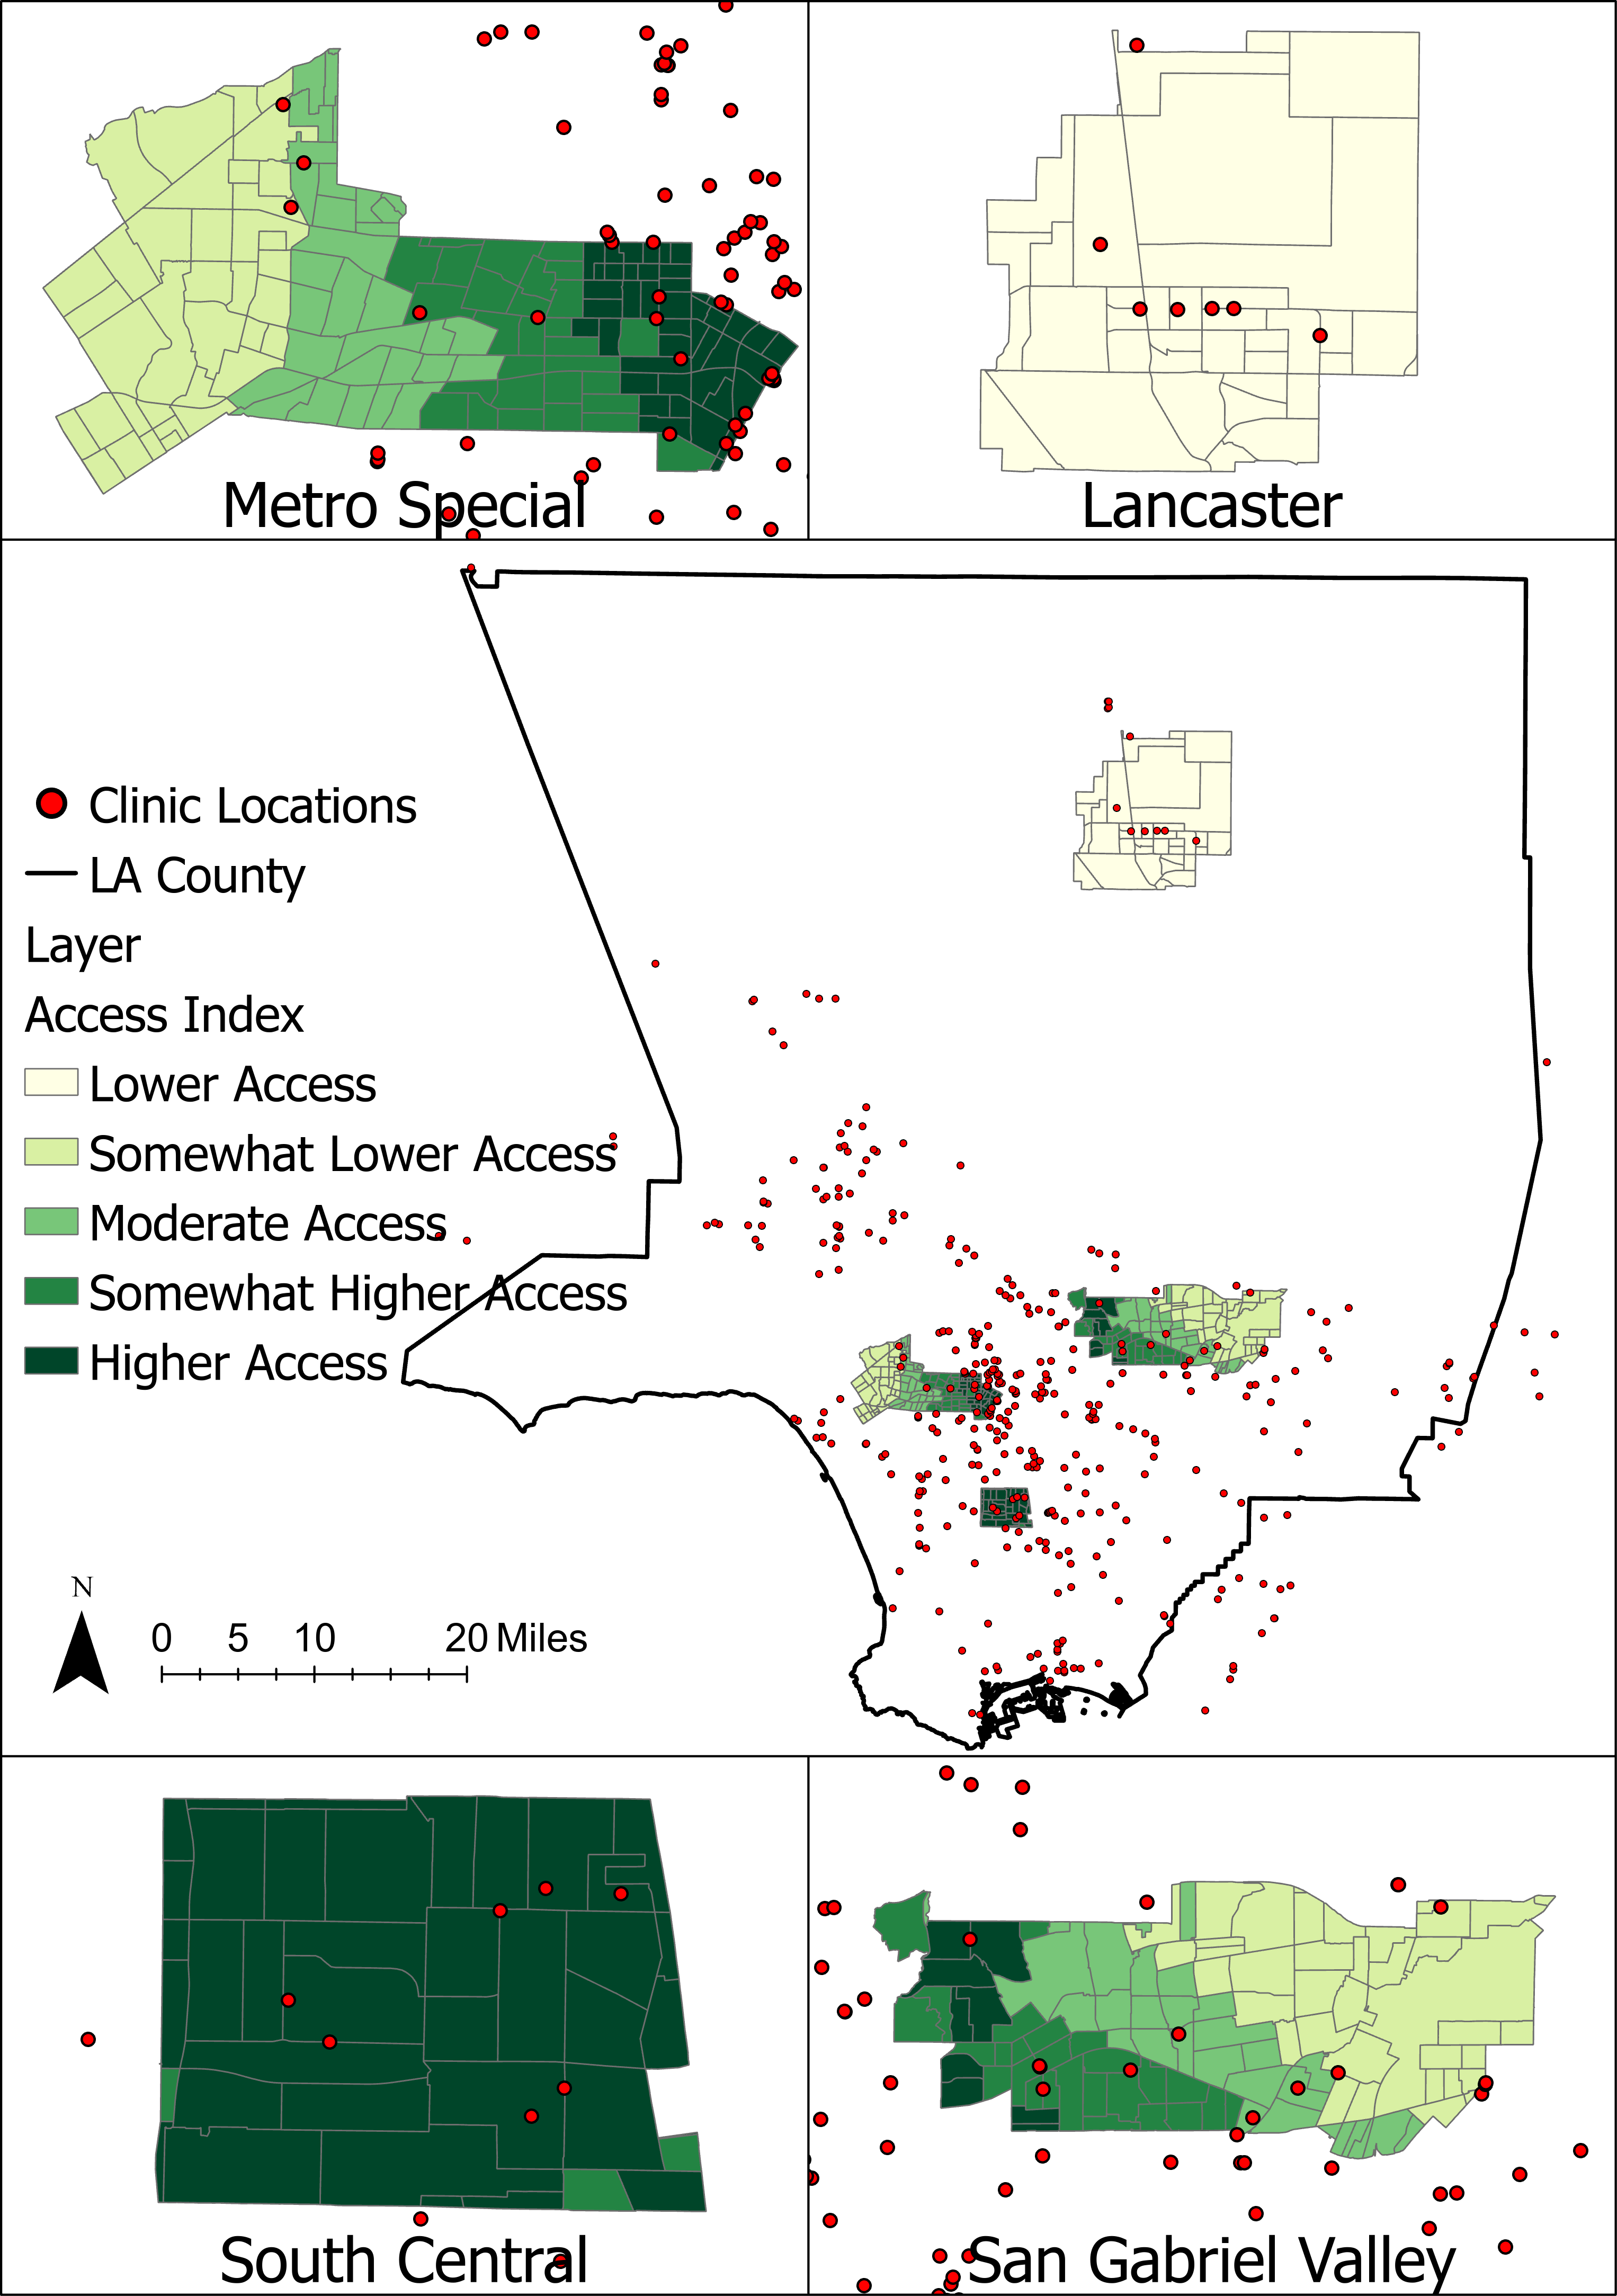
The areas of interest are four selected service areas of the Department of Public Social Services (DPSS), three within the LA metropolitan area and one in an outlying city north of the county's urban center. Contained within each service area is a single DPSS office that intended to serve all of the residents in need for that area. Additionally, hundreds of free and community clinics are scattered across the county and beyond. Clinics in adjacent counties but near the border were also included to mitigate edge effects of municipal boundaries.
Using demographic data, Provider-Population ratios (PPrs) were calculated for each census tract within each service area, indicating the ratio of service providers to population for each tract. In this case, each area has a single DPSSS office with tens of thousands of residents. PPrs, while not considered rigorous, are a relatively quick and basic method to estimate accessibility of services with an area of interest and can inform methodological developments.
The 2 Step Floating Catchment Area Method (2SFCA) was also implemented to create Spatial Accessibility Values (SAVs) for the target populations and compared with the PPrs. This method uses population centroids for each census tract, drawing user-defined catchment areas around each centroid and counting the total number of service providers using the Business Analyst Extension in ArcGIS Pro. This method has an advantage over the previous as it allows for the calculation of SAVs for each individual tract rather than treating the entire region as homogenous.
The map above shows the results of this study, with tracts color coded by the degree of healthcare access. It should be noted that this map simply indicate access and does not necessarily translate to utilization of these medical services.