
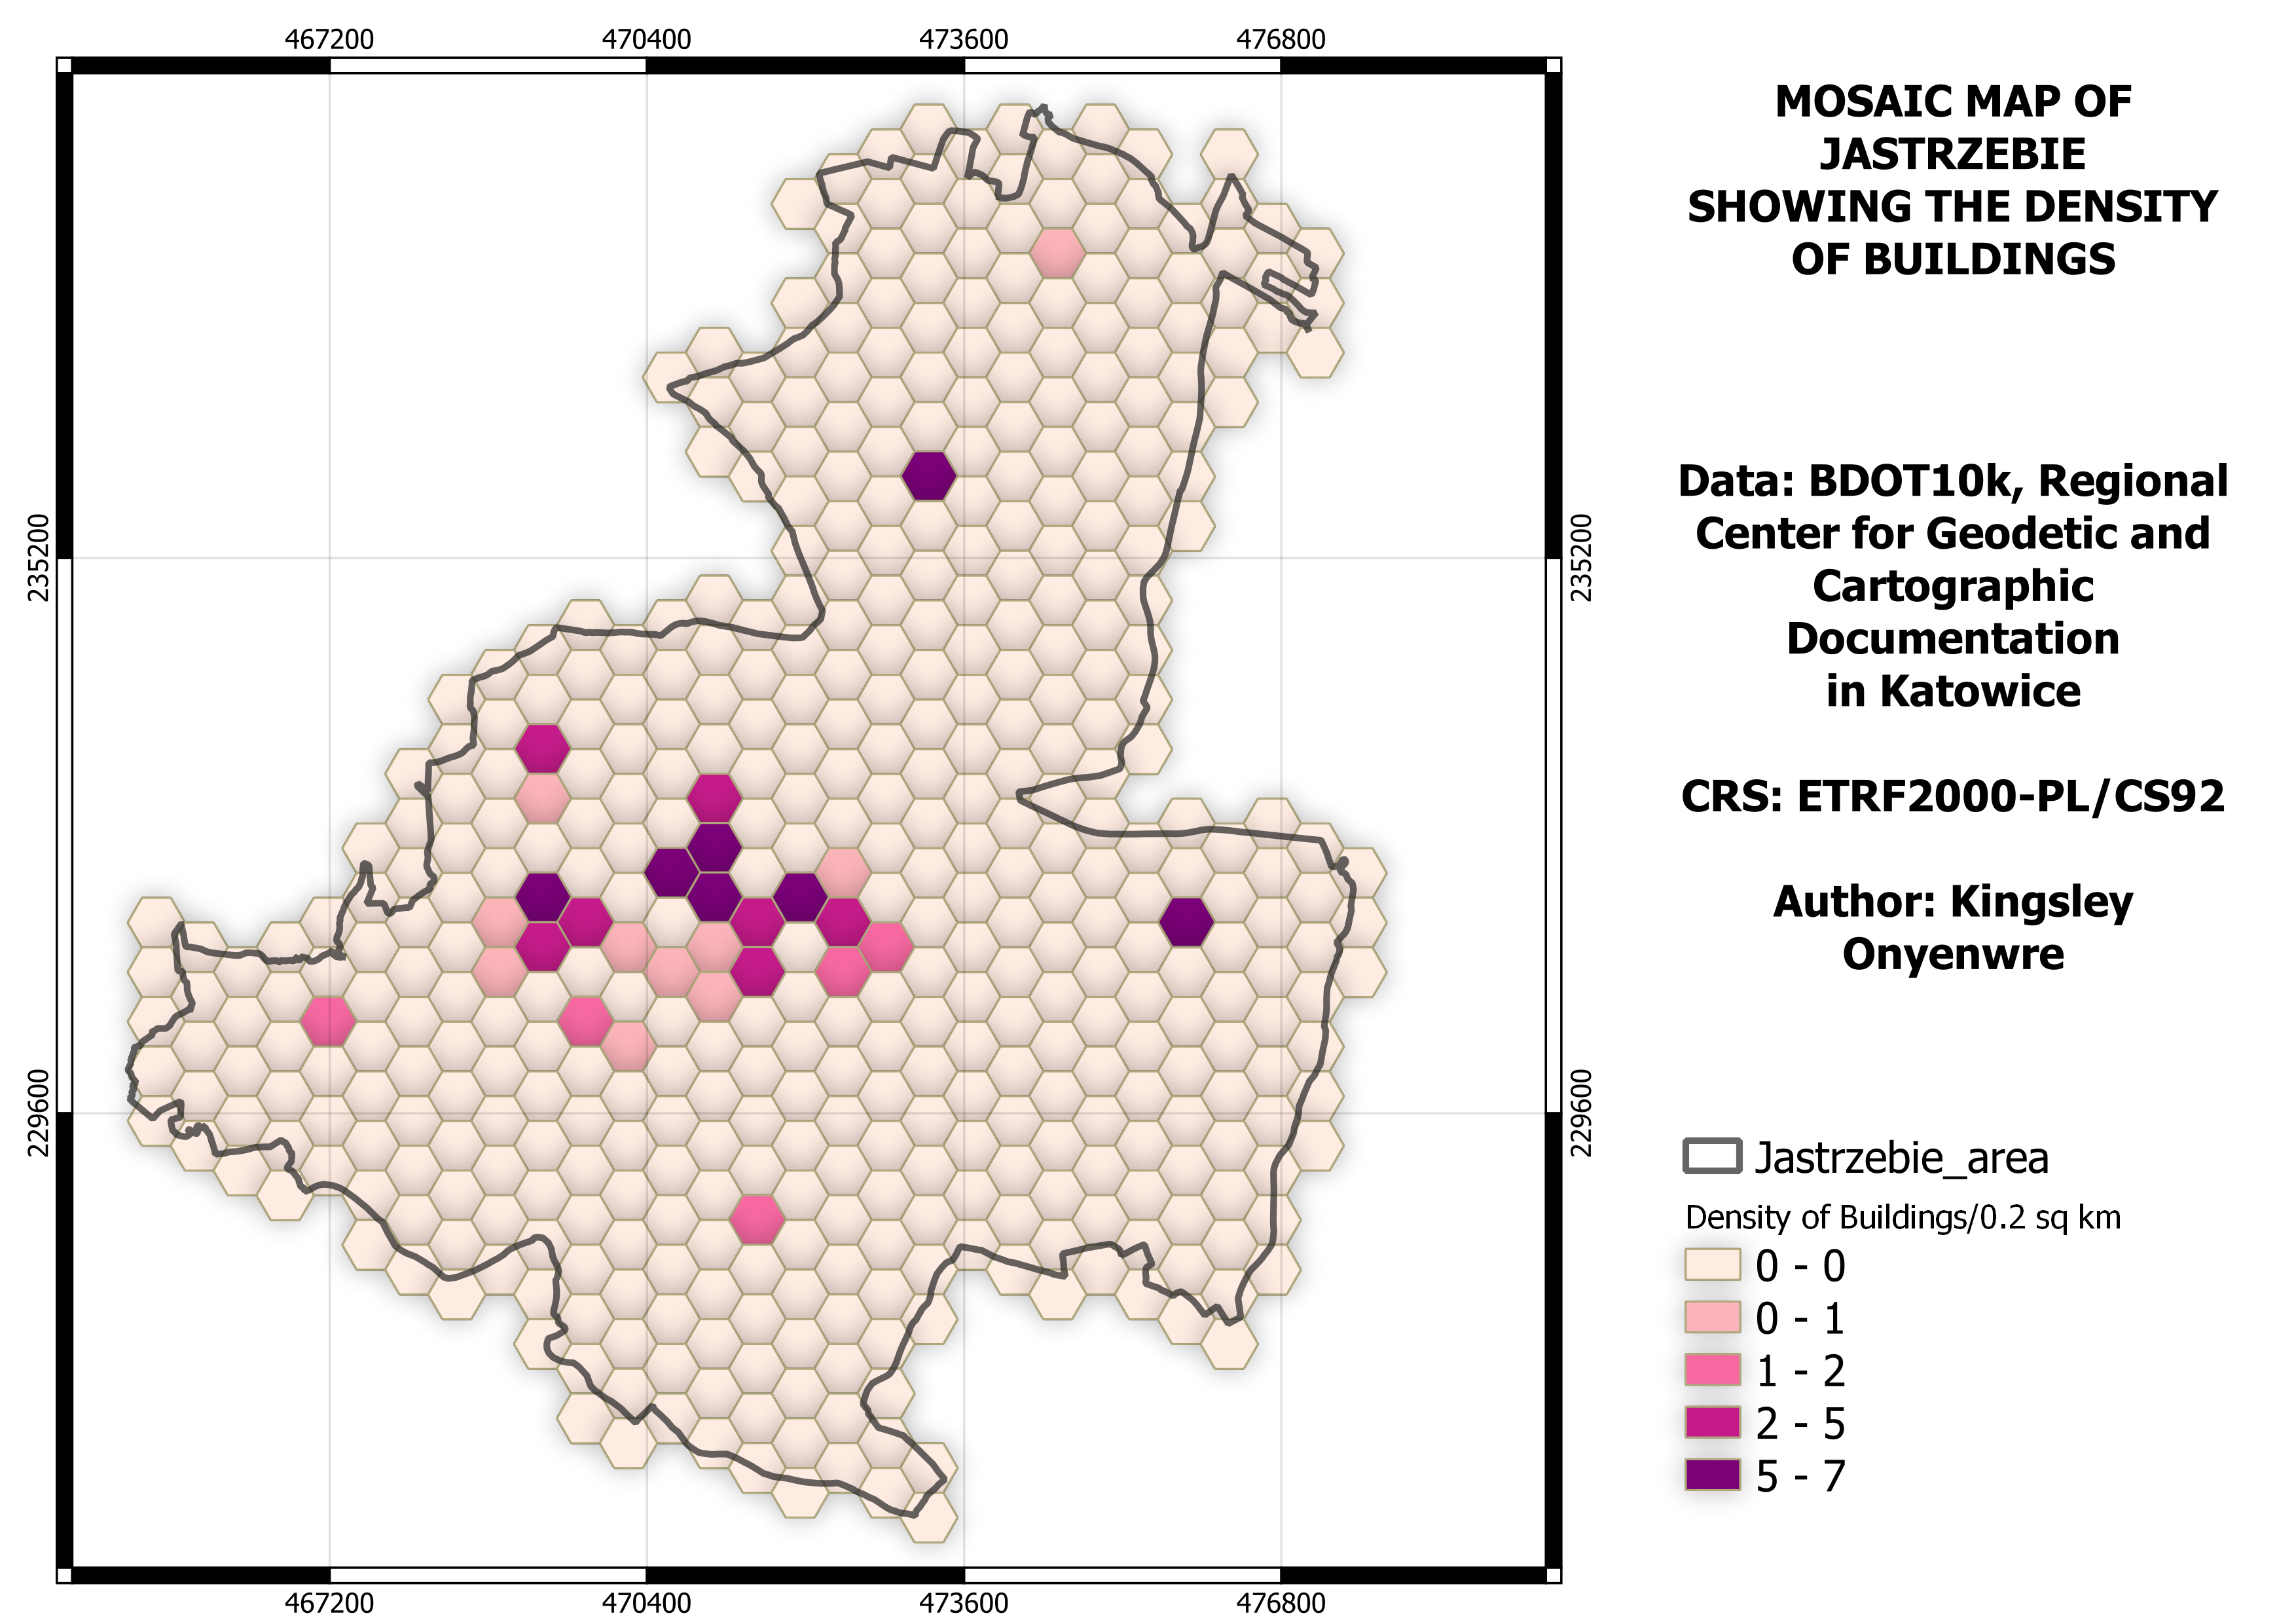
The map was created using data from the Regional Center for Geodetic and Cartographic Documentation in Katowice. The mosiac map dipicts the density of building in the city. The QGIS2Threejs plugin was used in creating the map
Mosaic Map Showing Density of Buildings
Tools used
QGIS
Plug-ins used
Qgis2threejs
tags
Building Density
More by Kingsley Onyenwere

You might also like
.png&w=3840&q=100)
 He")


Join the community!
We're a place where geospatial professionals showcase their works and discover opportunities.