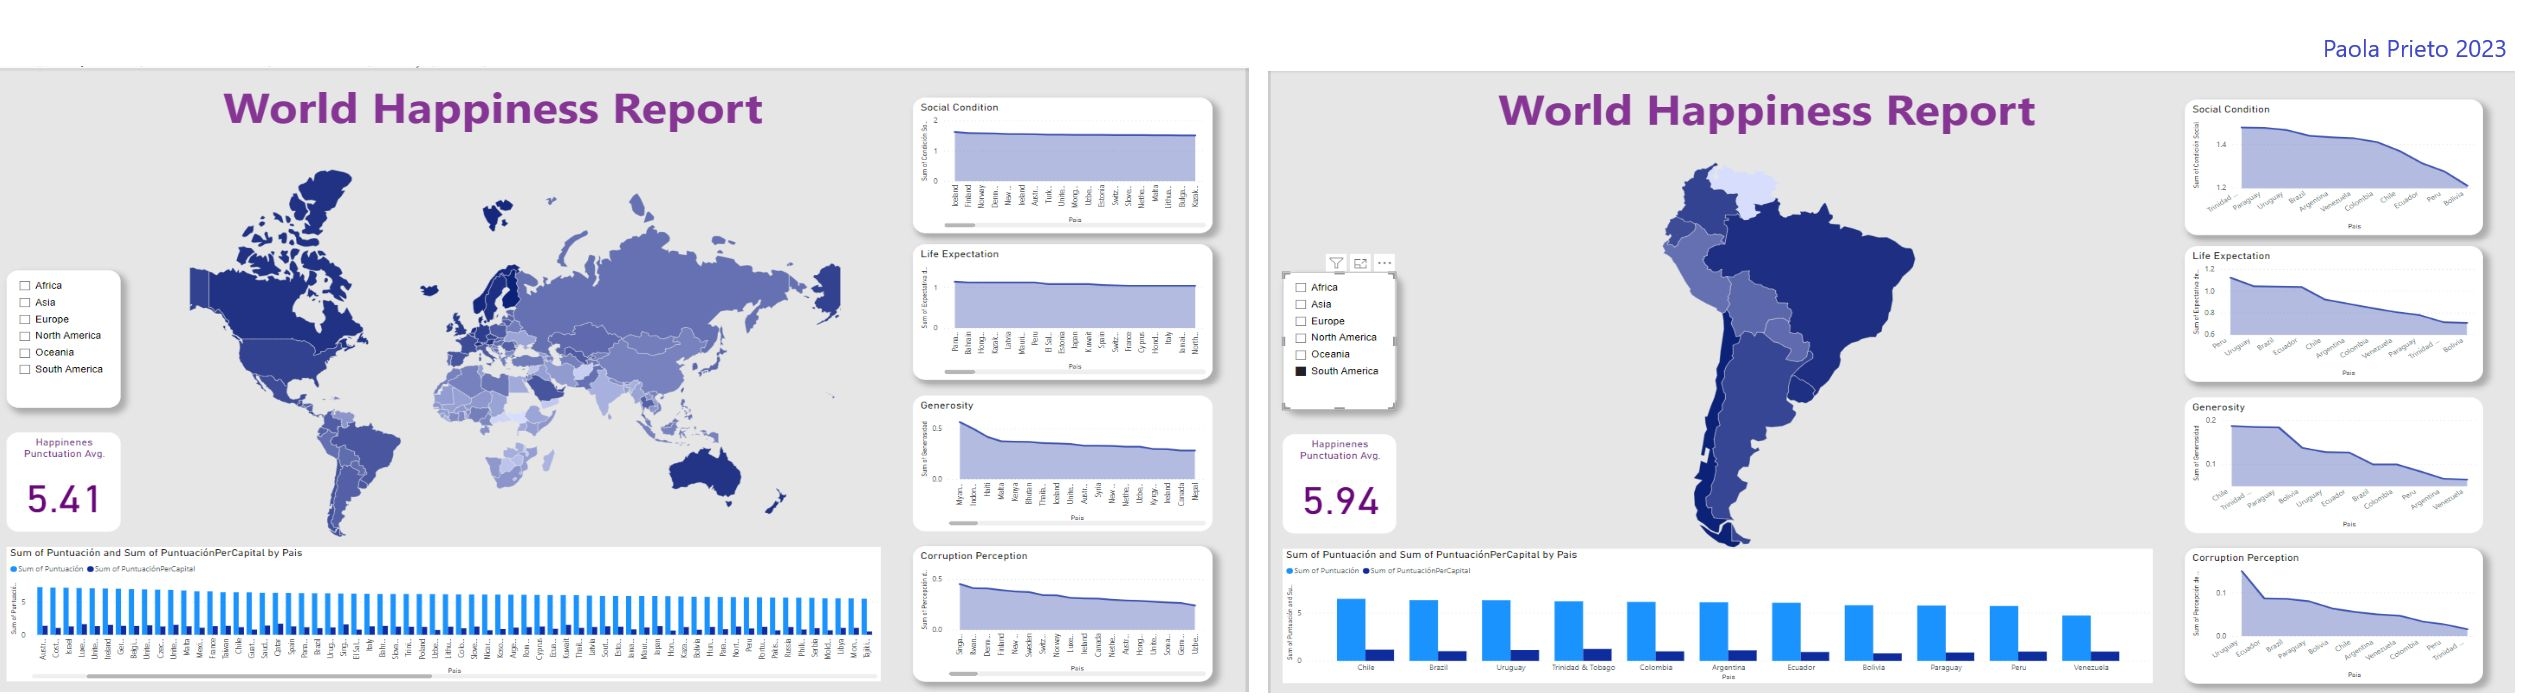
In this project, I used the PowerBI Shape Map - visualization, which is still under Beta development. This type of shape map allows us to use the attribute data from a shape file, which we will need to load into PowerBI as CSV or XLS file, and then, we can add a JSON map in order to get the map and the desired countries shown.
A disadvantage with this tool is that we cannot locate a point exactly in the map with its coordinates, as these are not present in the attribute file, we can only show areas and point to them with the country name for example.
Inspired by Diana M. from MTA


.svg "Keran Nkongolo")