
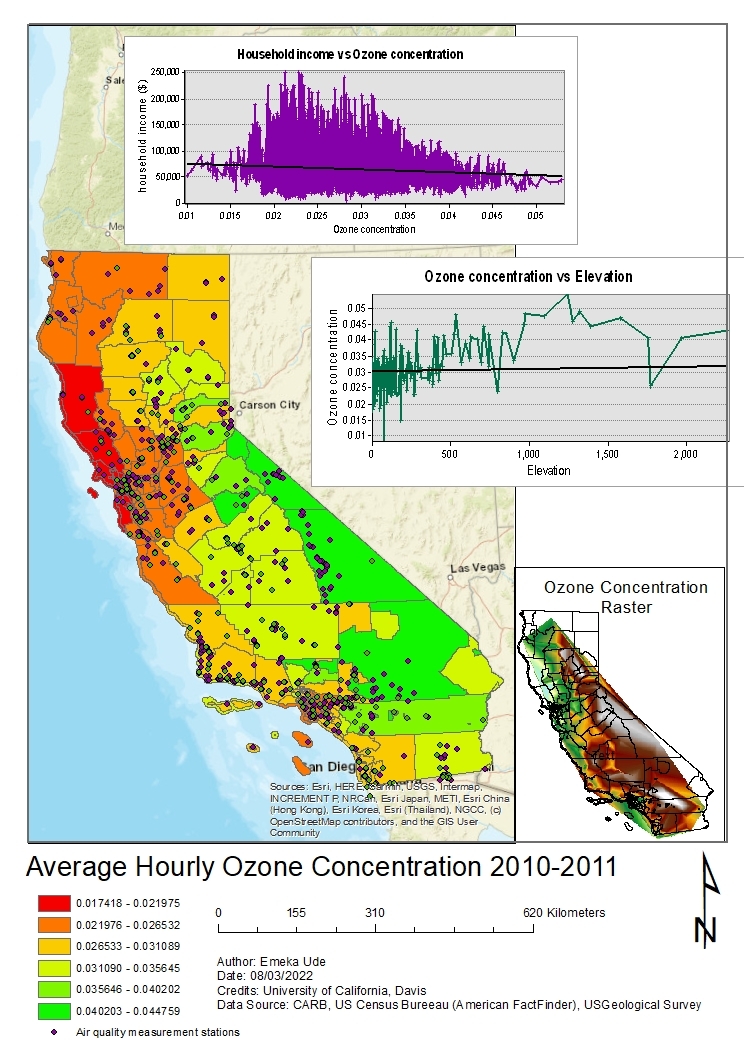
- The projects shows the distribution of Ozone in California.
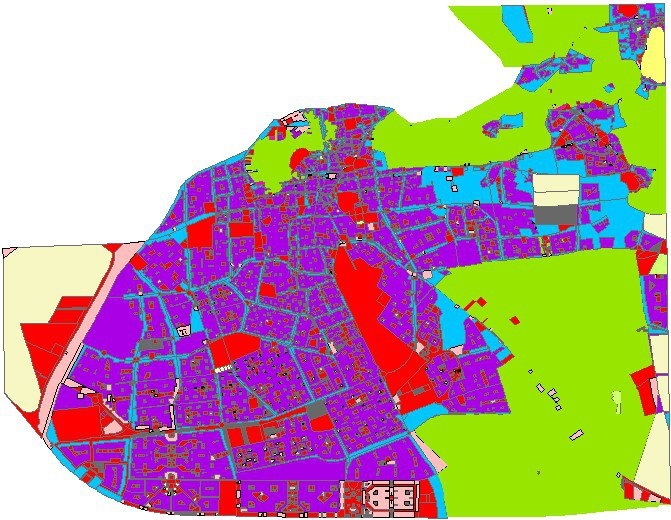
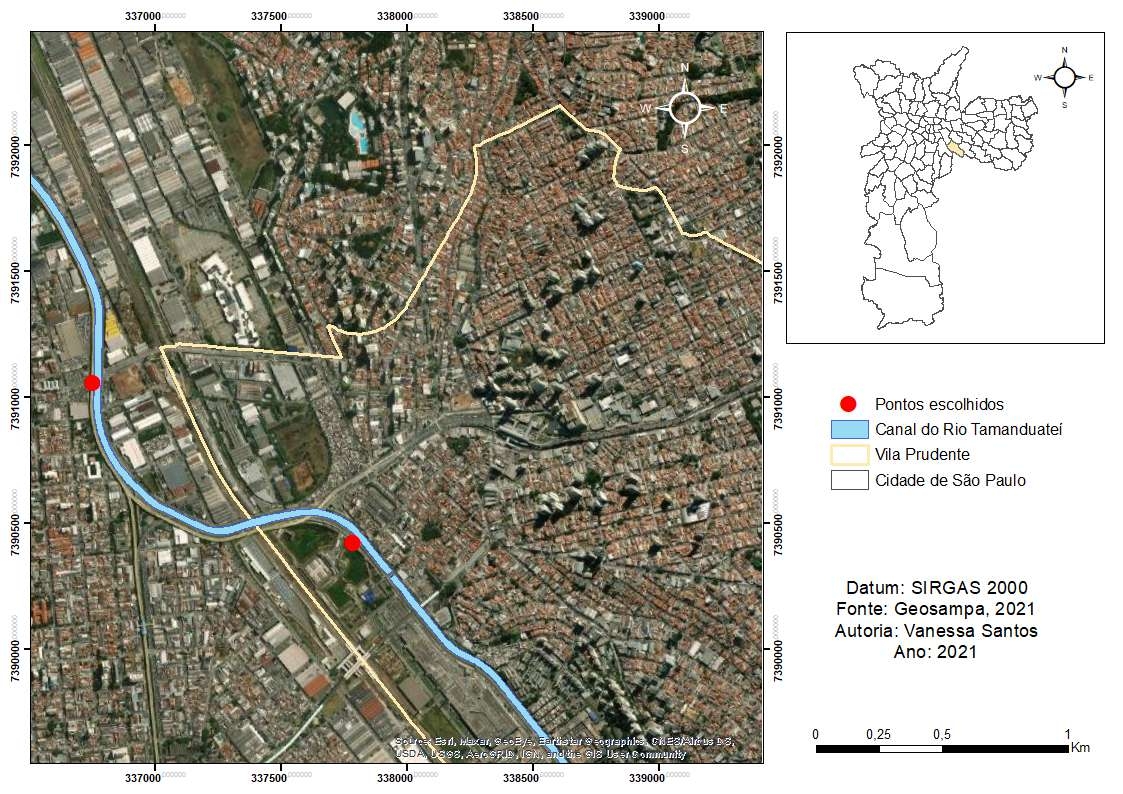
- Record of ozone concentration was obtained from different points and was used to create a raster file as shown in the secondary map.
- Relationship between ozone concentration, elevation and the average Income for different locations and counties are represented on the charts.
Hourly Ozone Distribution in California
Tools used
ArcMap
Plug-ins used
ArcMap
tags
Environmental ManagementPoint-in-PolygonRaster Calculator
More by Emeka Ude


You might also like


Join the community!
We're a place where geospatial professionals showcase their works and discover opportunities.