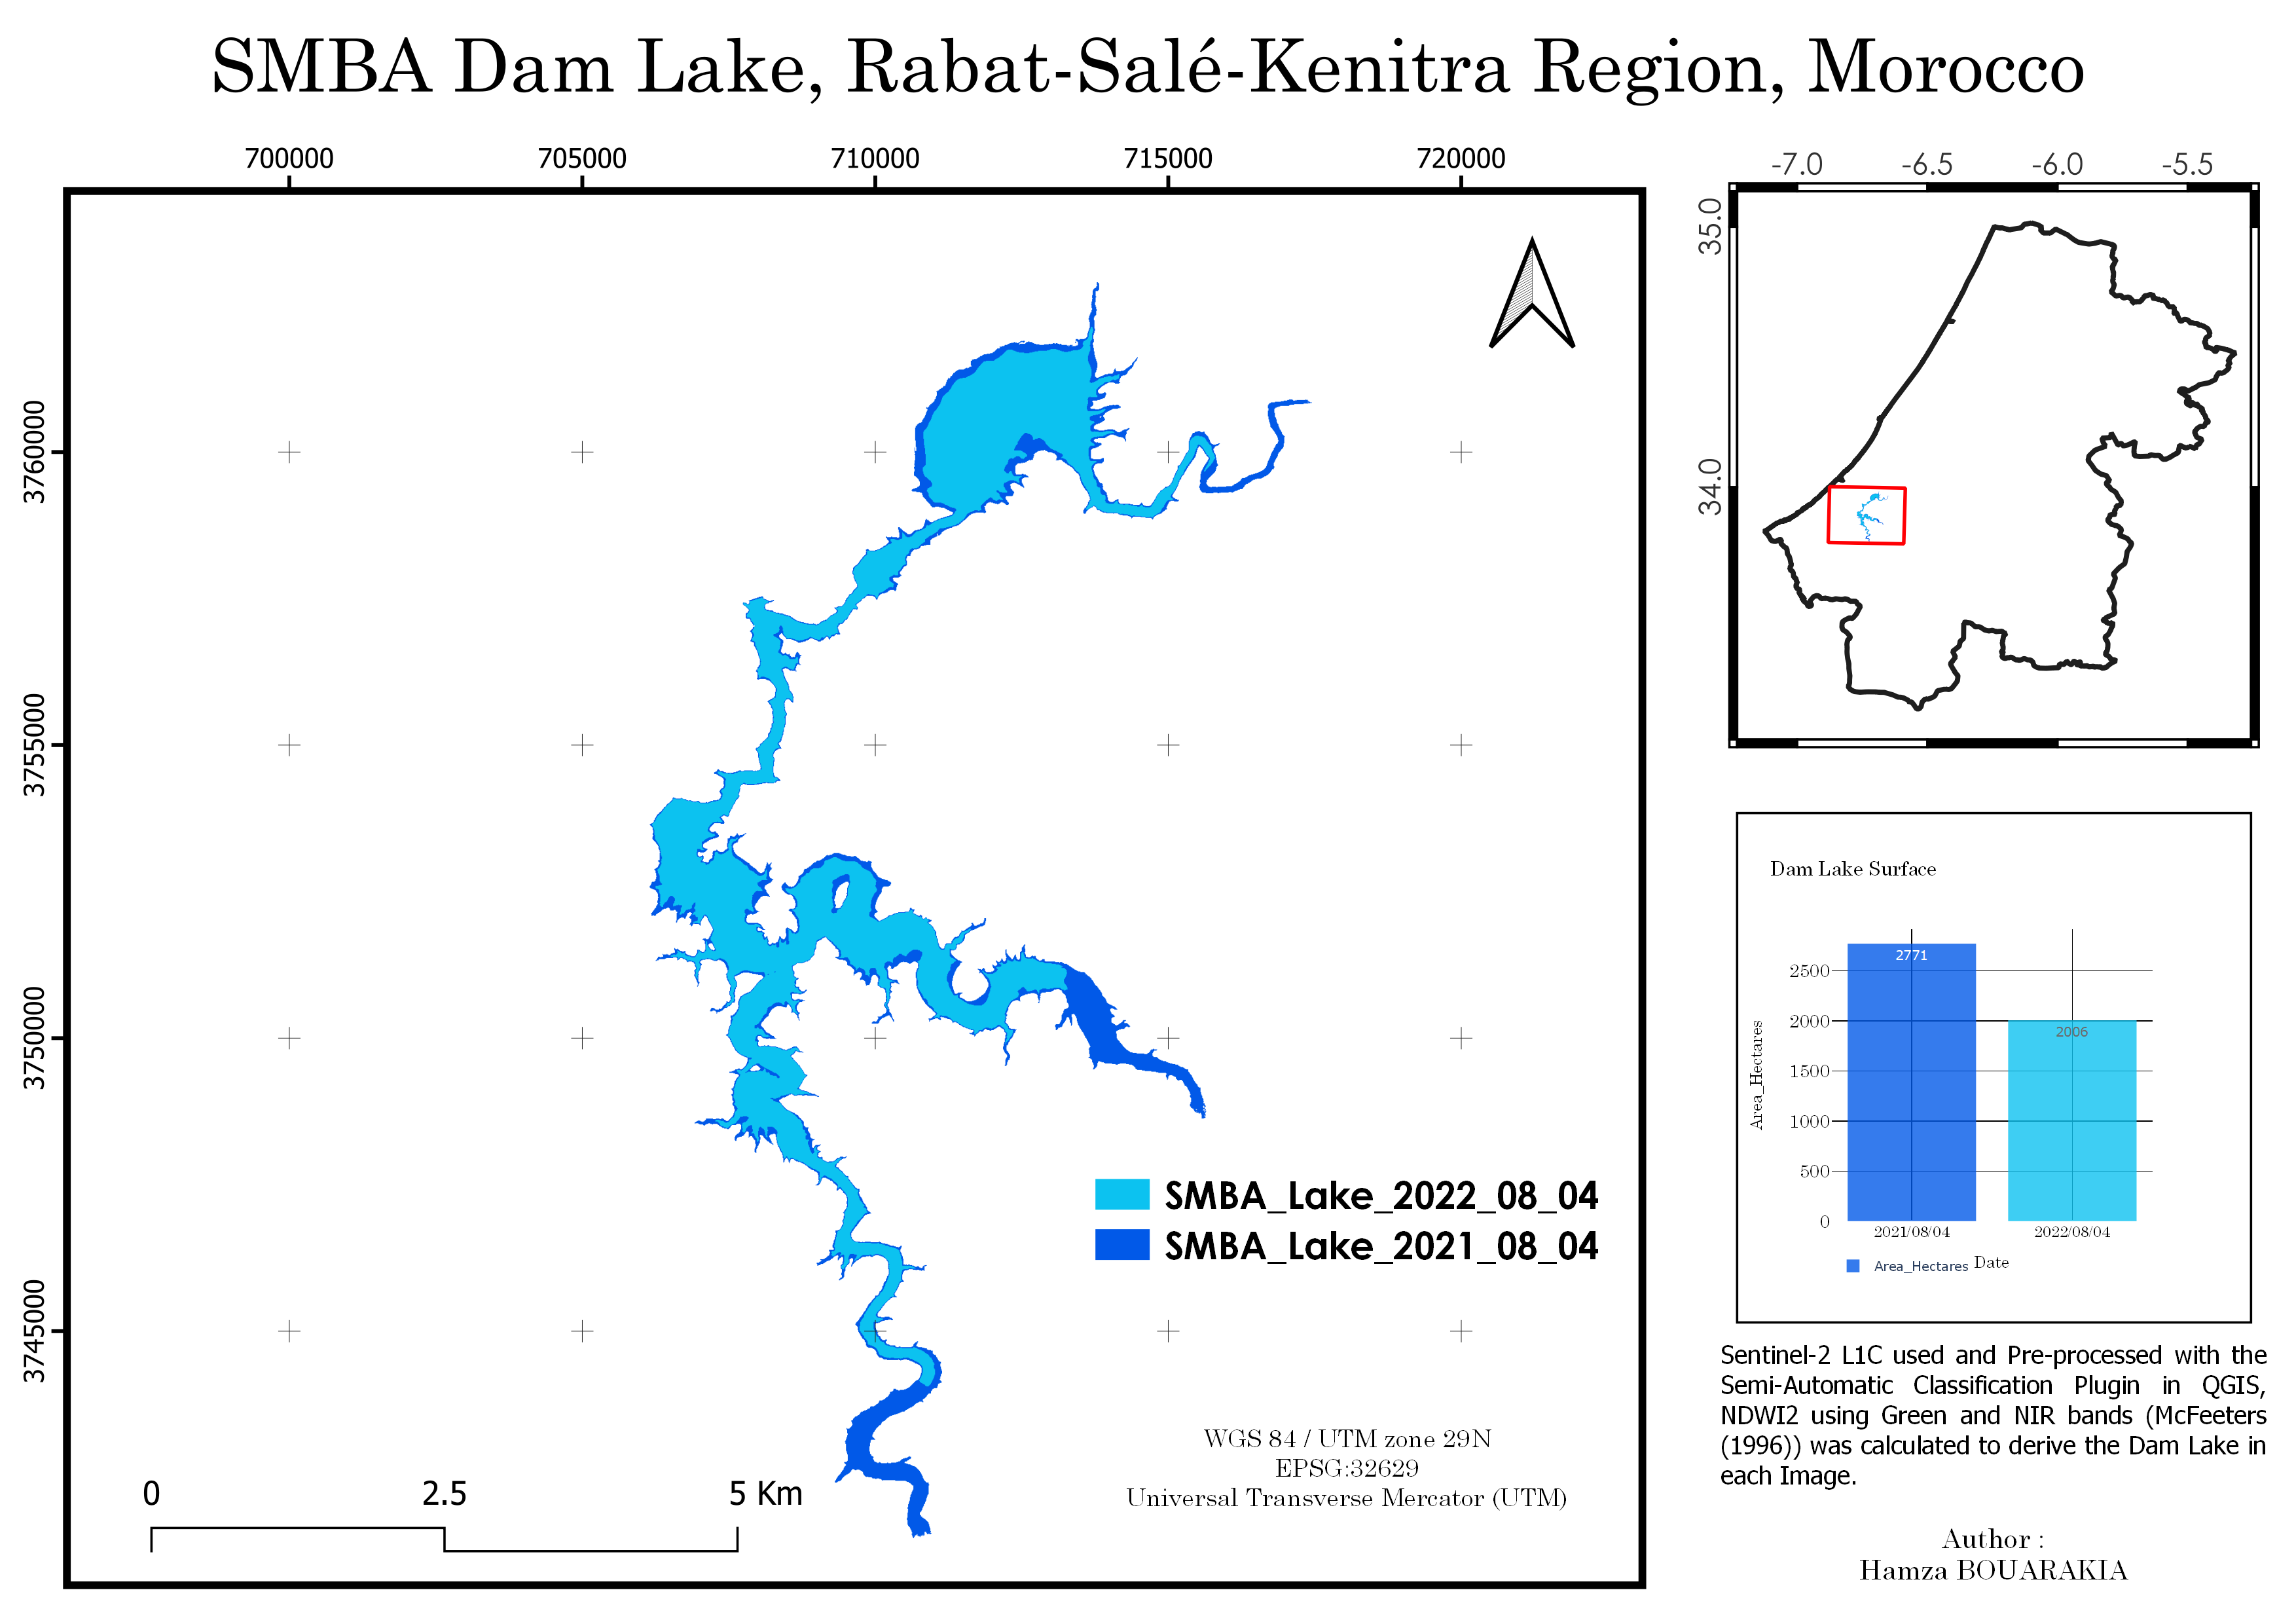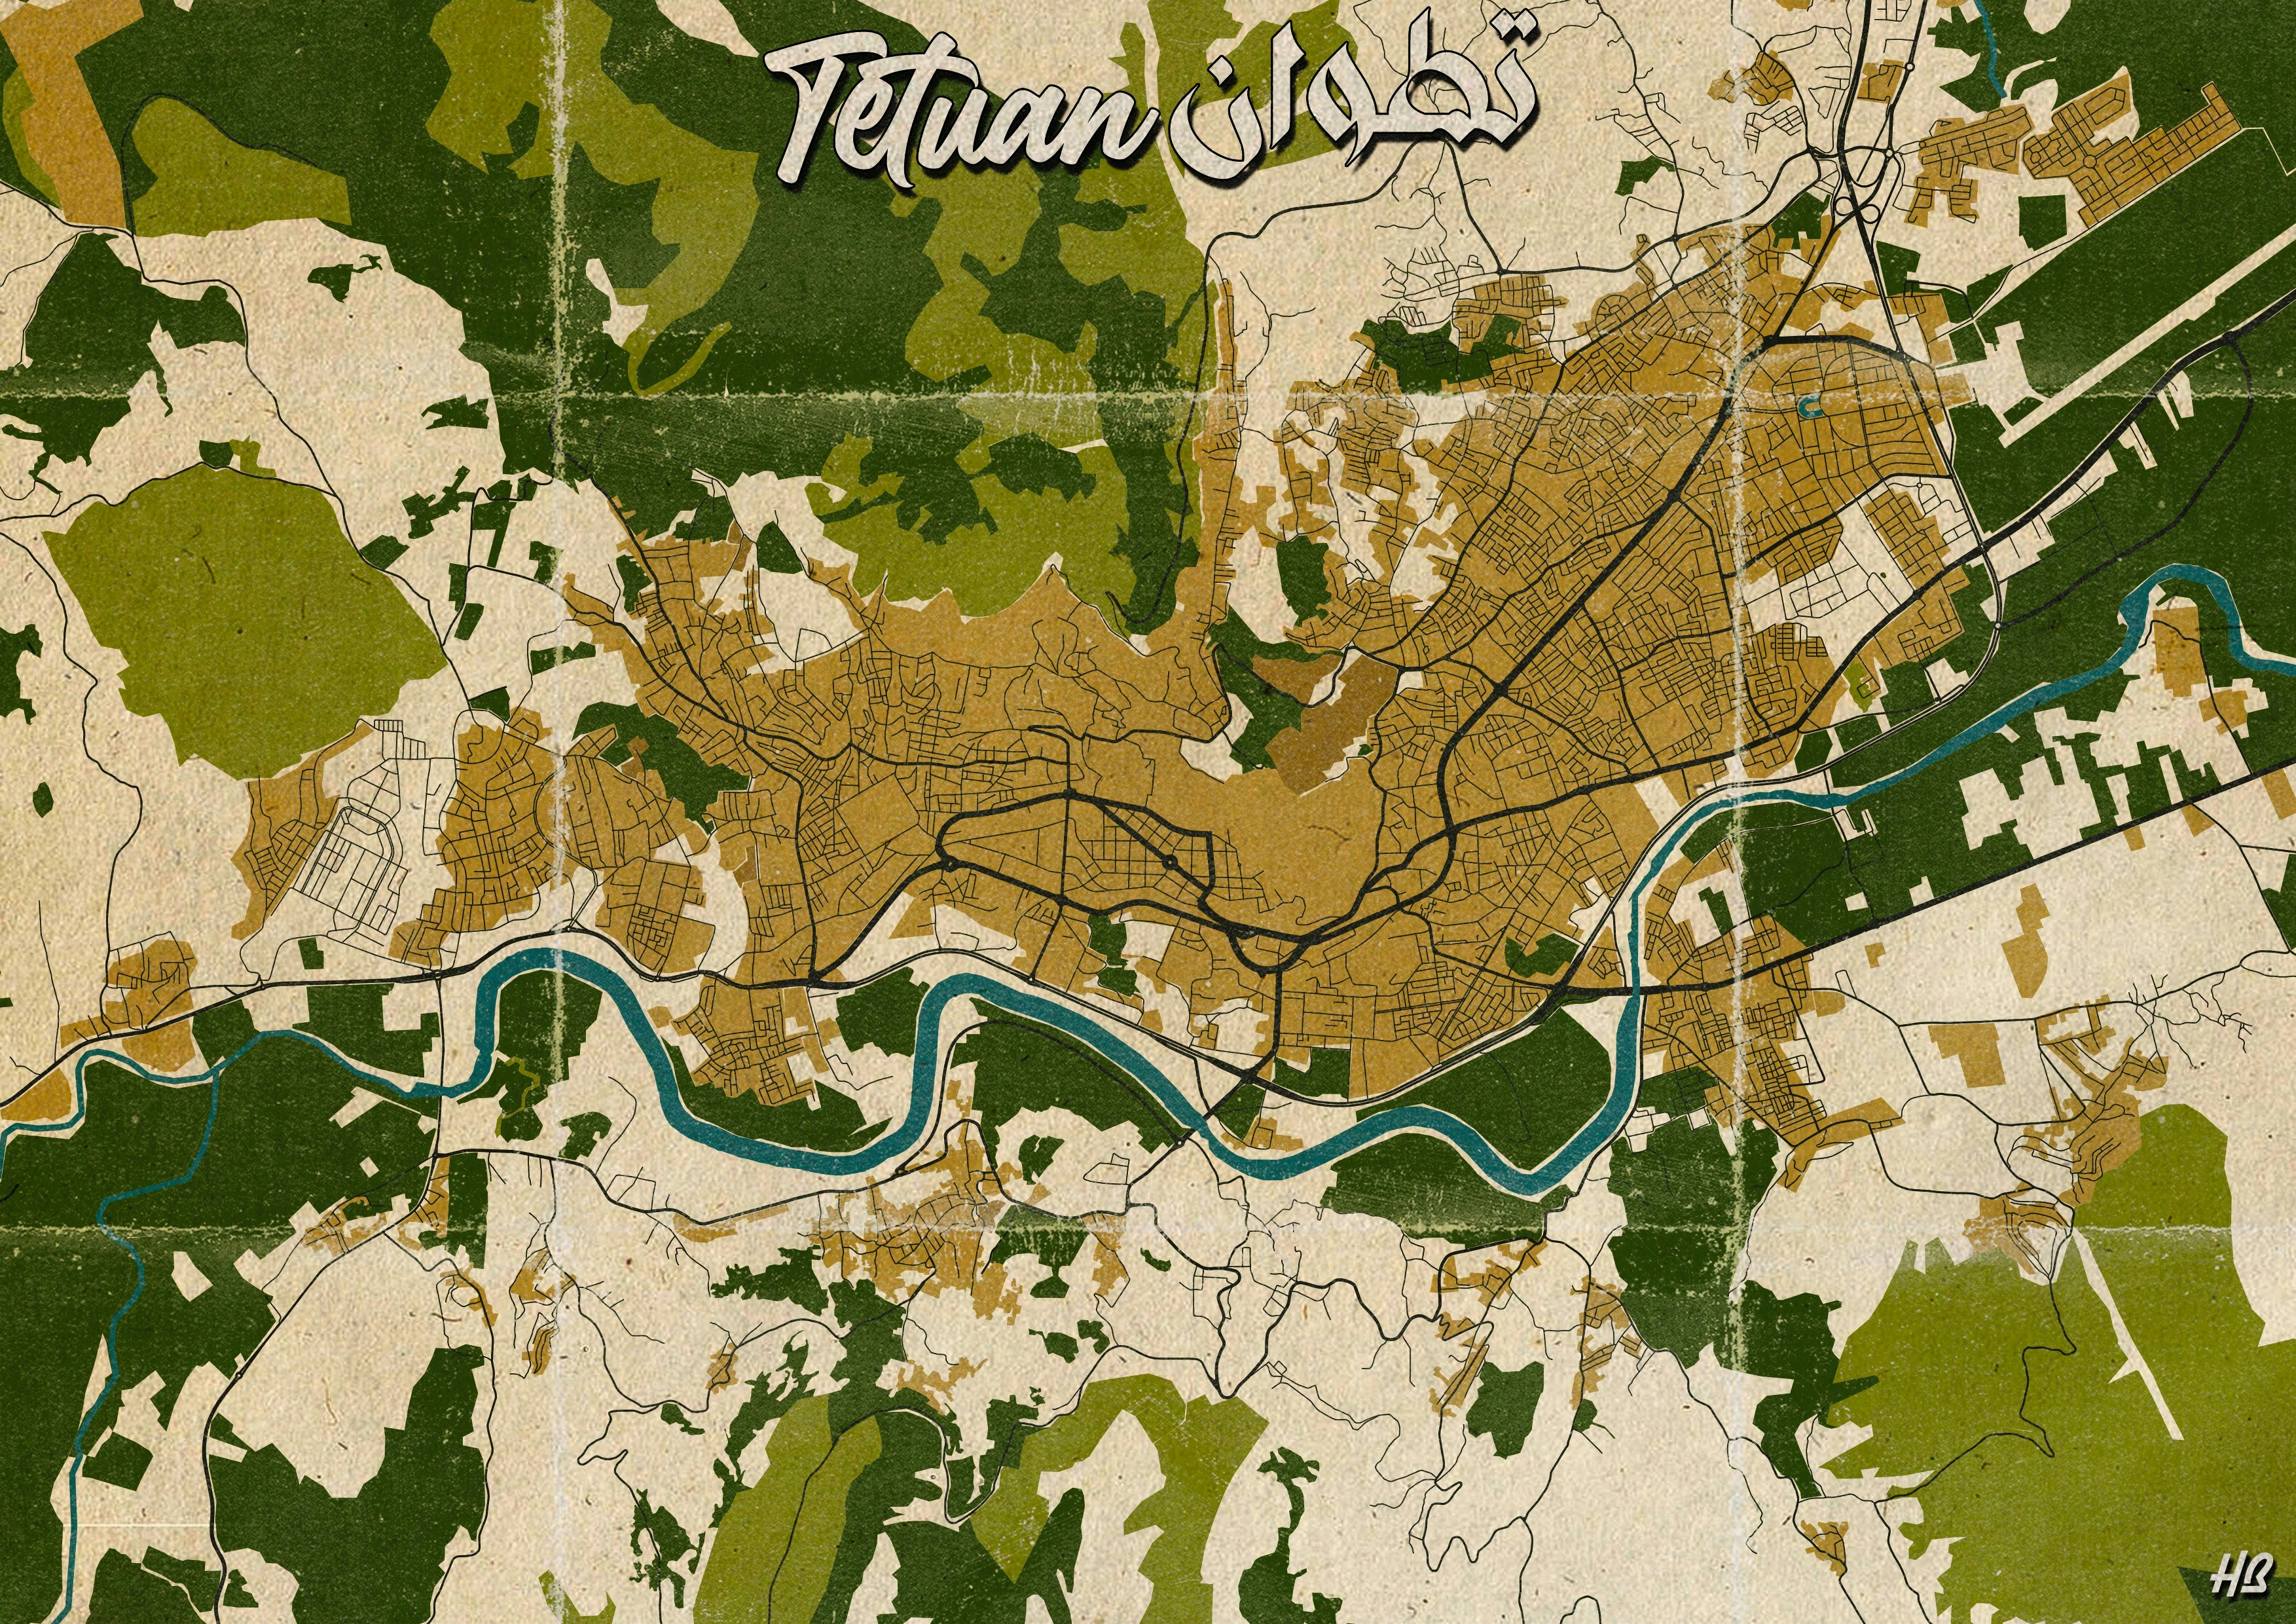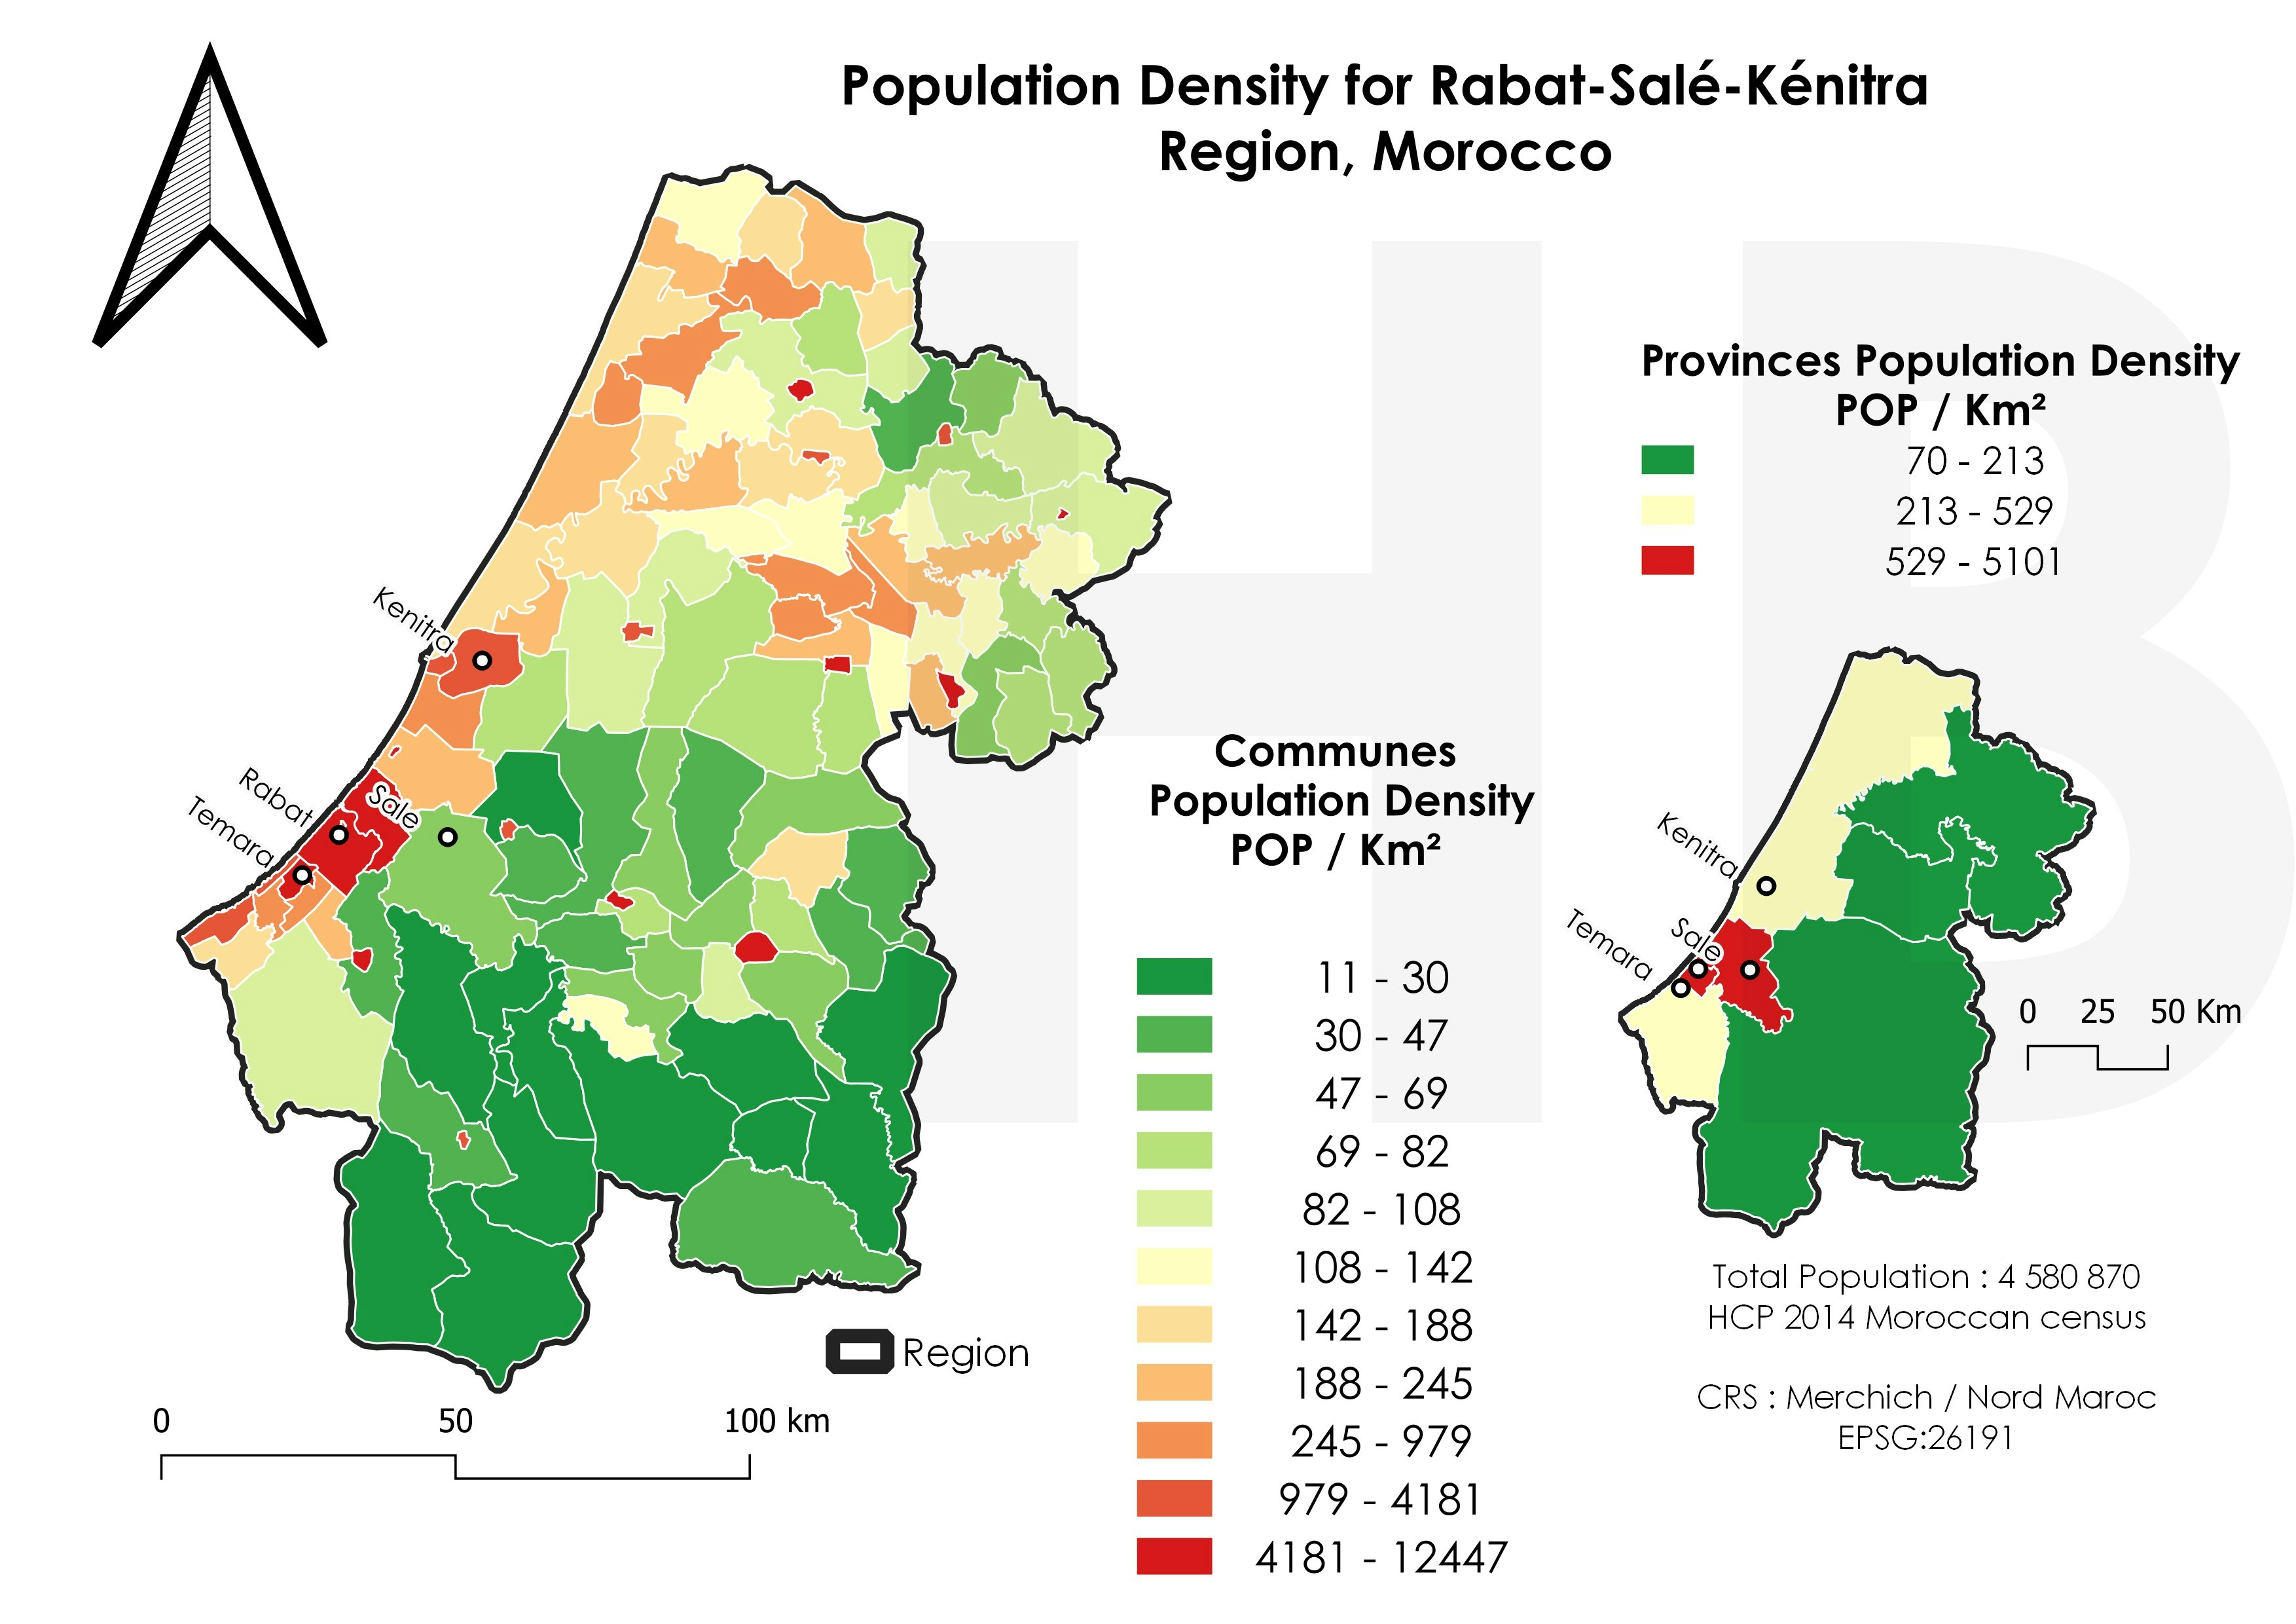
The map was entirely made in QGIS.
This population density map uses the administrative divisions of Morocco adopted in 2015, the population data was taken from the Moroccan 2014 Census made by HCP..
A quantile classification method and defining 11 classes and a graduated color map varying from Green (Low Population Density) to Red (High Population Density) were used for this map.