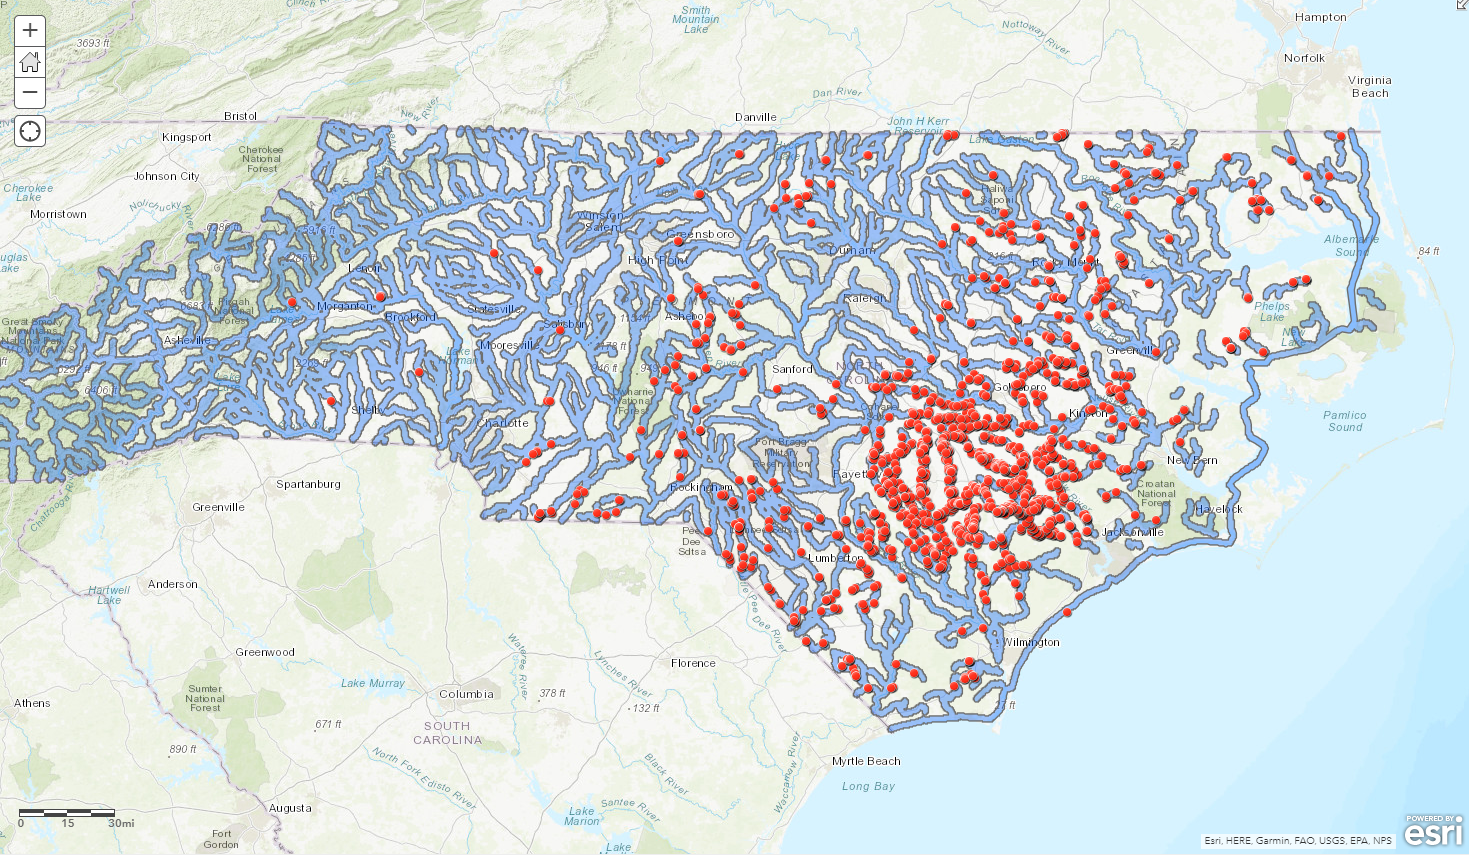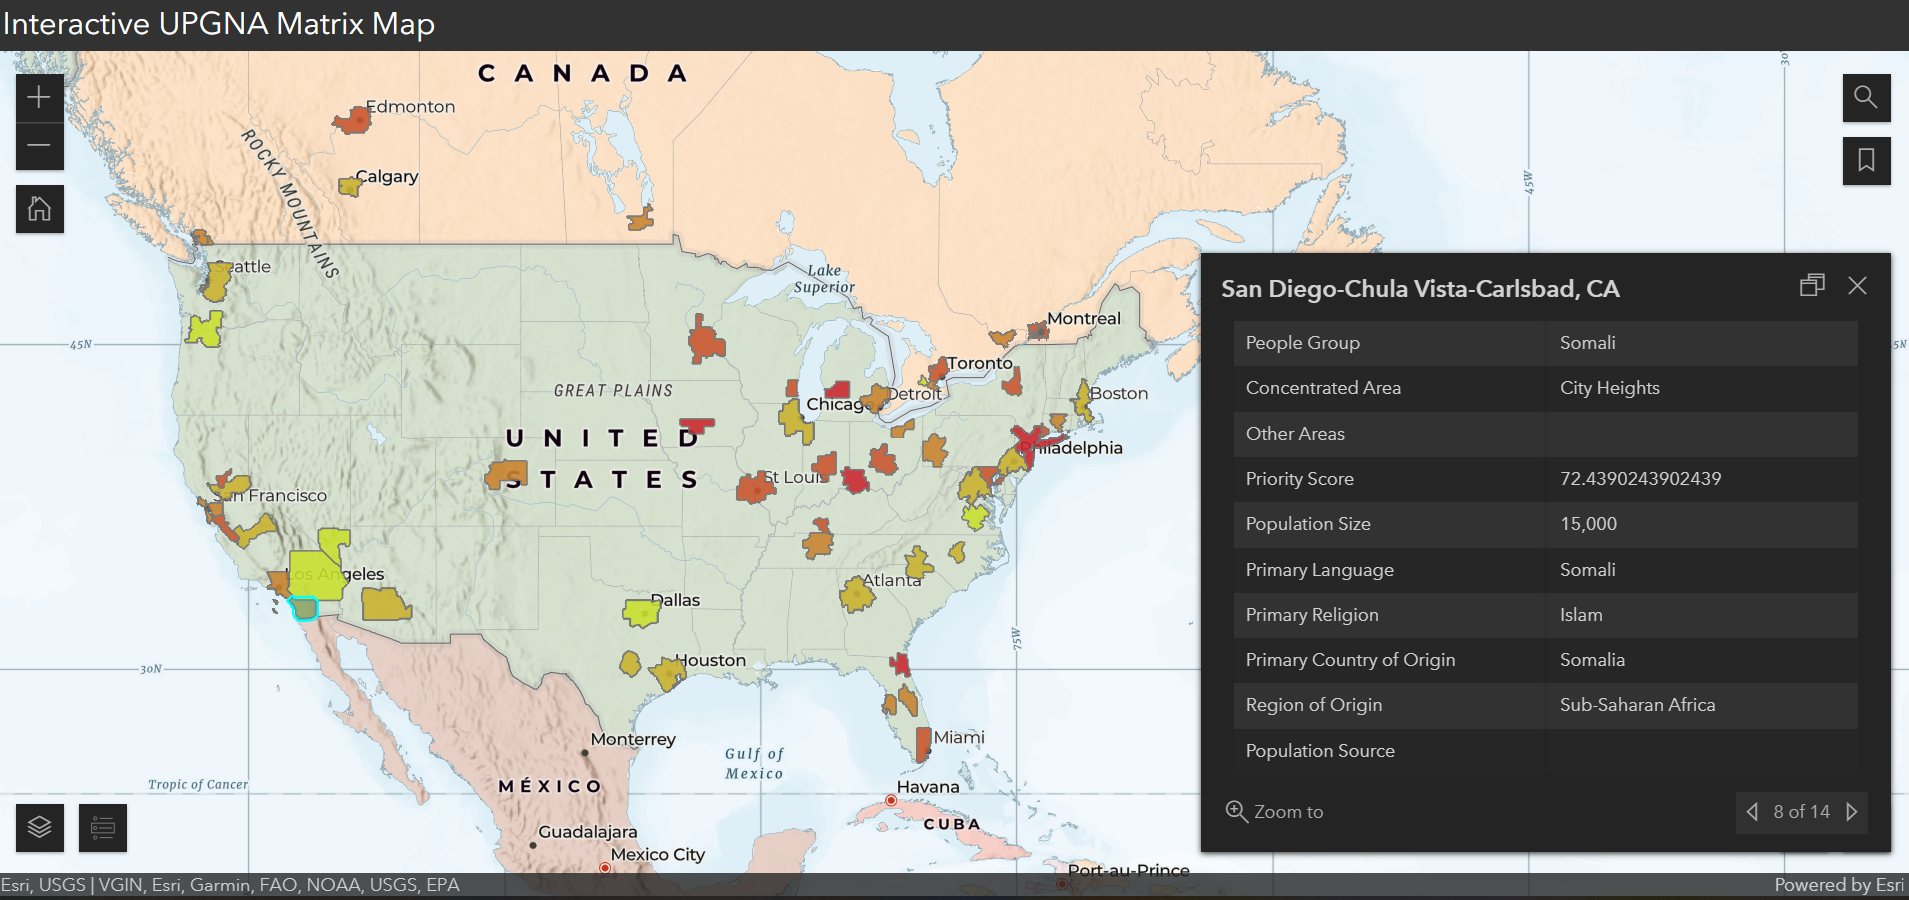
This project was created with data from Global Gates' Unreached People Groups North America Priority Matrix. The data visualized here is publicly available on their website. Click on the demo link below to interact with the map in my app!
My workflow is described below:
- Downloaded TIGER shapefile for census MSA/CSA boundaries
- Cleaned data in Excel from Priority Matrix (Aligning CBSA/MS/CSA names down to the accent in Montréal) *Ensured the Title of the column/field where MSA/CSA names are stored is identical.
- Saved Excel sheet as a .csv file
- Used the XY to Point geoprocessing tool to add each people group in a city as a point feature from the .csv file.
- Performed a Spatial Join, where parameters will join any feature from the point feature class that a census boundary polygon "contains". Uncheck the box to keep all target features in the spatial join parameters.
- Exported data in new joined polygon layer to feature class (Help)
- Used geoprocessing tools to create new feature classes in the geodatabase and highlight statistics in the Priority Matrix.
- Summary Statistics to create UPGs Per Area using [People Group, Population Size, Priority Score, Primary Language, and Primary Religion] as fields, [Count, Sum, Mean, Unique, and Unique] as the statistic types respectively with "Name" as the case field.
- Joined the new Table to the polygon feature class with the following parameters:
- Input Table: Layer to which the table will be joined
- Input Join Field: Name
- Join Table: [select newly created summary statistics table] (all fields must have the "Double" data type)
- Join Table Field: Name
- Uncheck Keep all Targets
- Check Index Joined Fields
- Symbolized each new feature class appropriately.
- Highlighted all new layers to add to your ArcGIS Online (AGOL) webmap > Right click > Share > As Web Layer
- Ensured that every feature layer was exported its own feature class.
- Set parameters and Publish
- Entered the related AGOL account where the web map was published.
- Created a new web map and add the feature layer just published to your AGOL organization.
- Ensured the Basemap is set to Charted Territories.
- Set transparency for each of the layers to 33% under Properties.
- Saved the Web Map with appropriate Title, Tags, and Summary.
- Configured an Interactive Legend web app from the web map in ArcGIS Online for a public audience.


.svg "Keran Nkongolo")