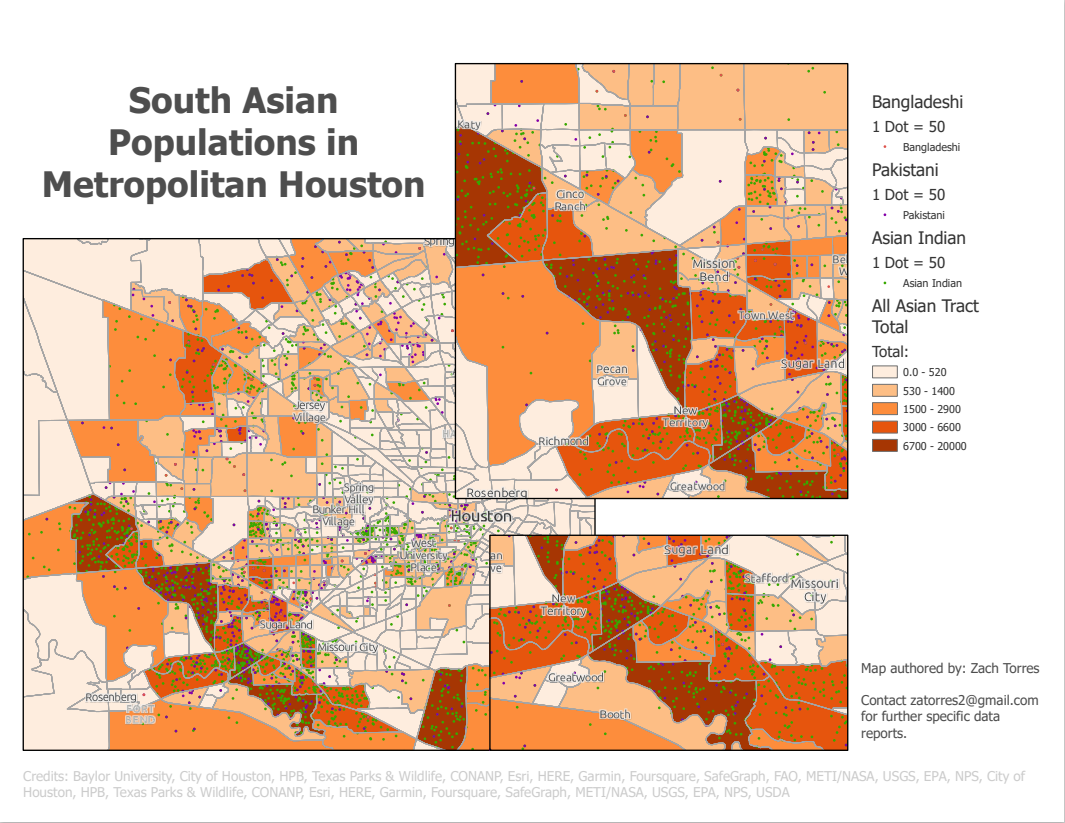
When a dataset contains more information than what a single static view should communicate, a small multiple layout is an effective way to communicate trends across time, data ranges, or even various datasets without the risk of change blindness in animations.
Here, I used small multiples as a map layout method to show nuance and detail in the spatial frequency of earthquakes according to their measurements on the Richter Scale. Data was organized into thematic classes to define earthquake symbol ranges. I utilized a filter range to slice map data into distinct views and create seven instances of the data.
Other tools used:
- Graduated symbols
- Transparency
- Layout grid
- Adding labels with Graphics and Text