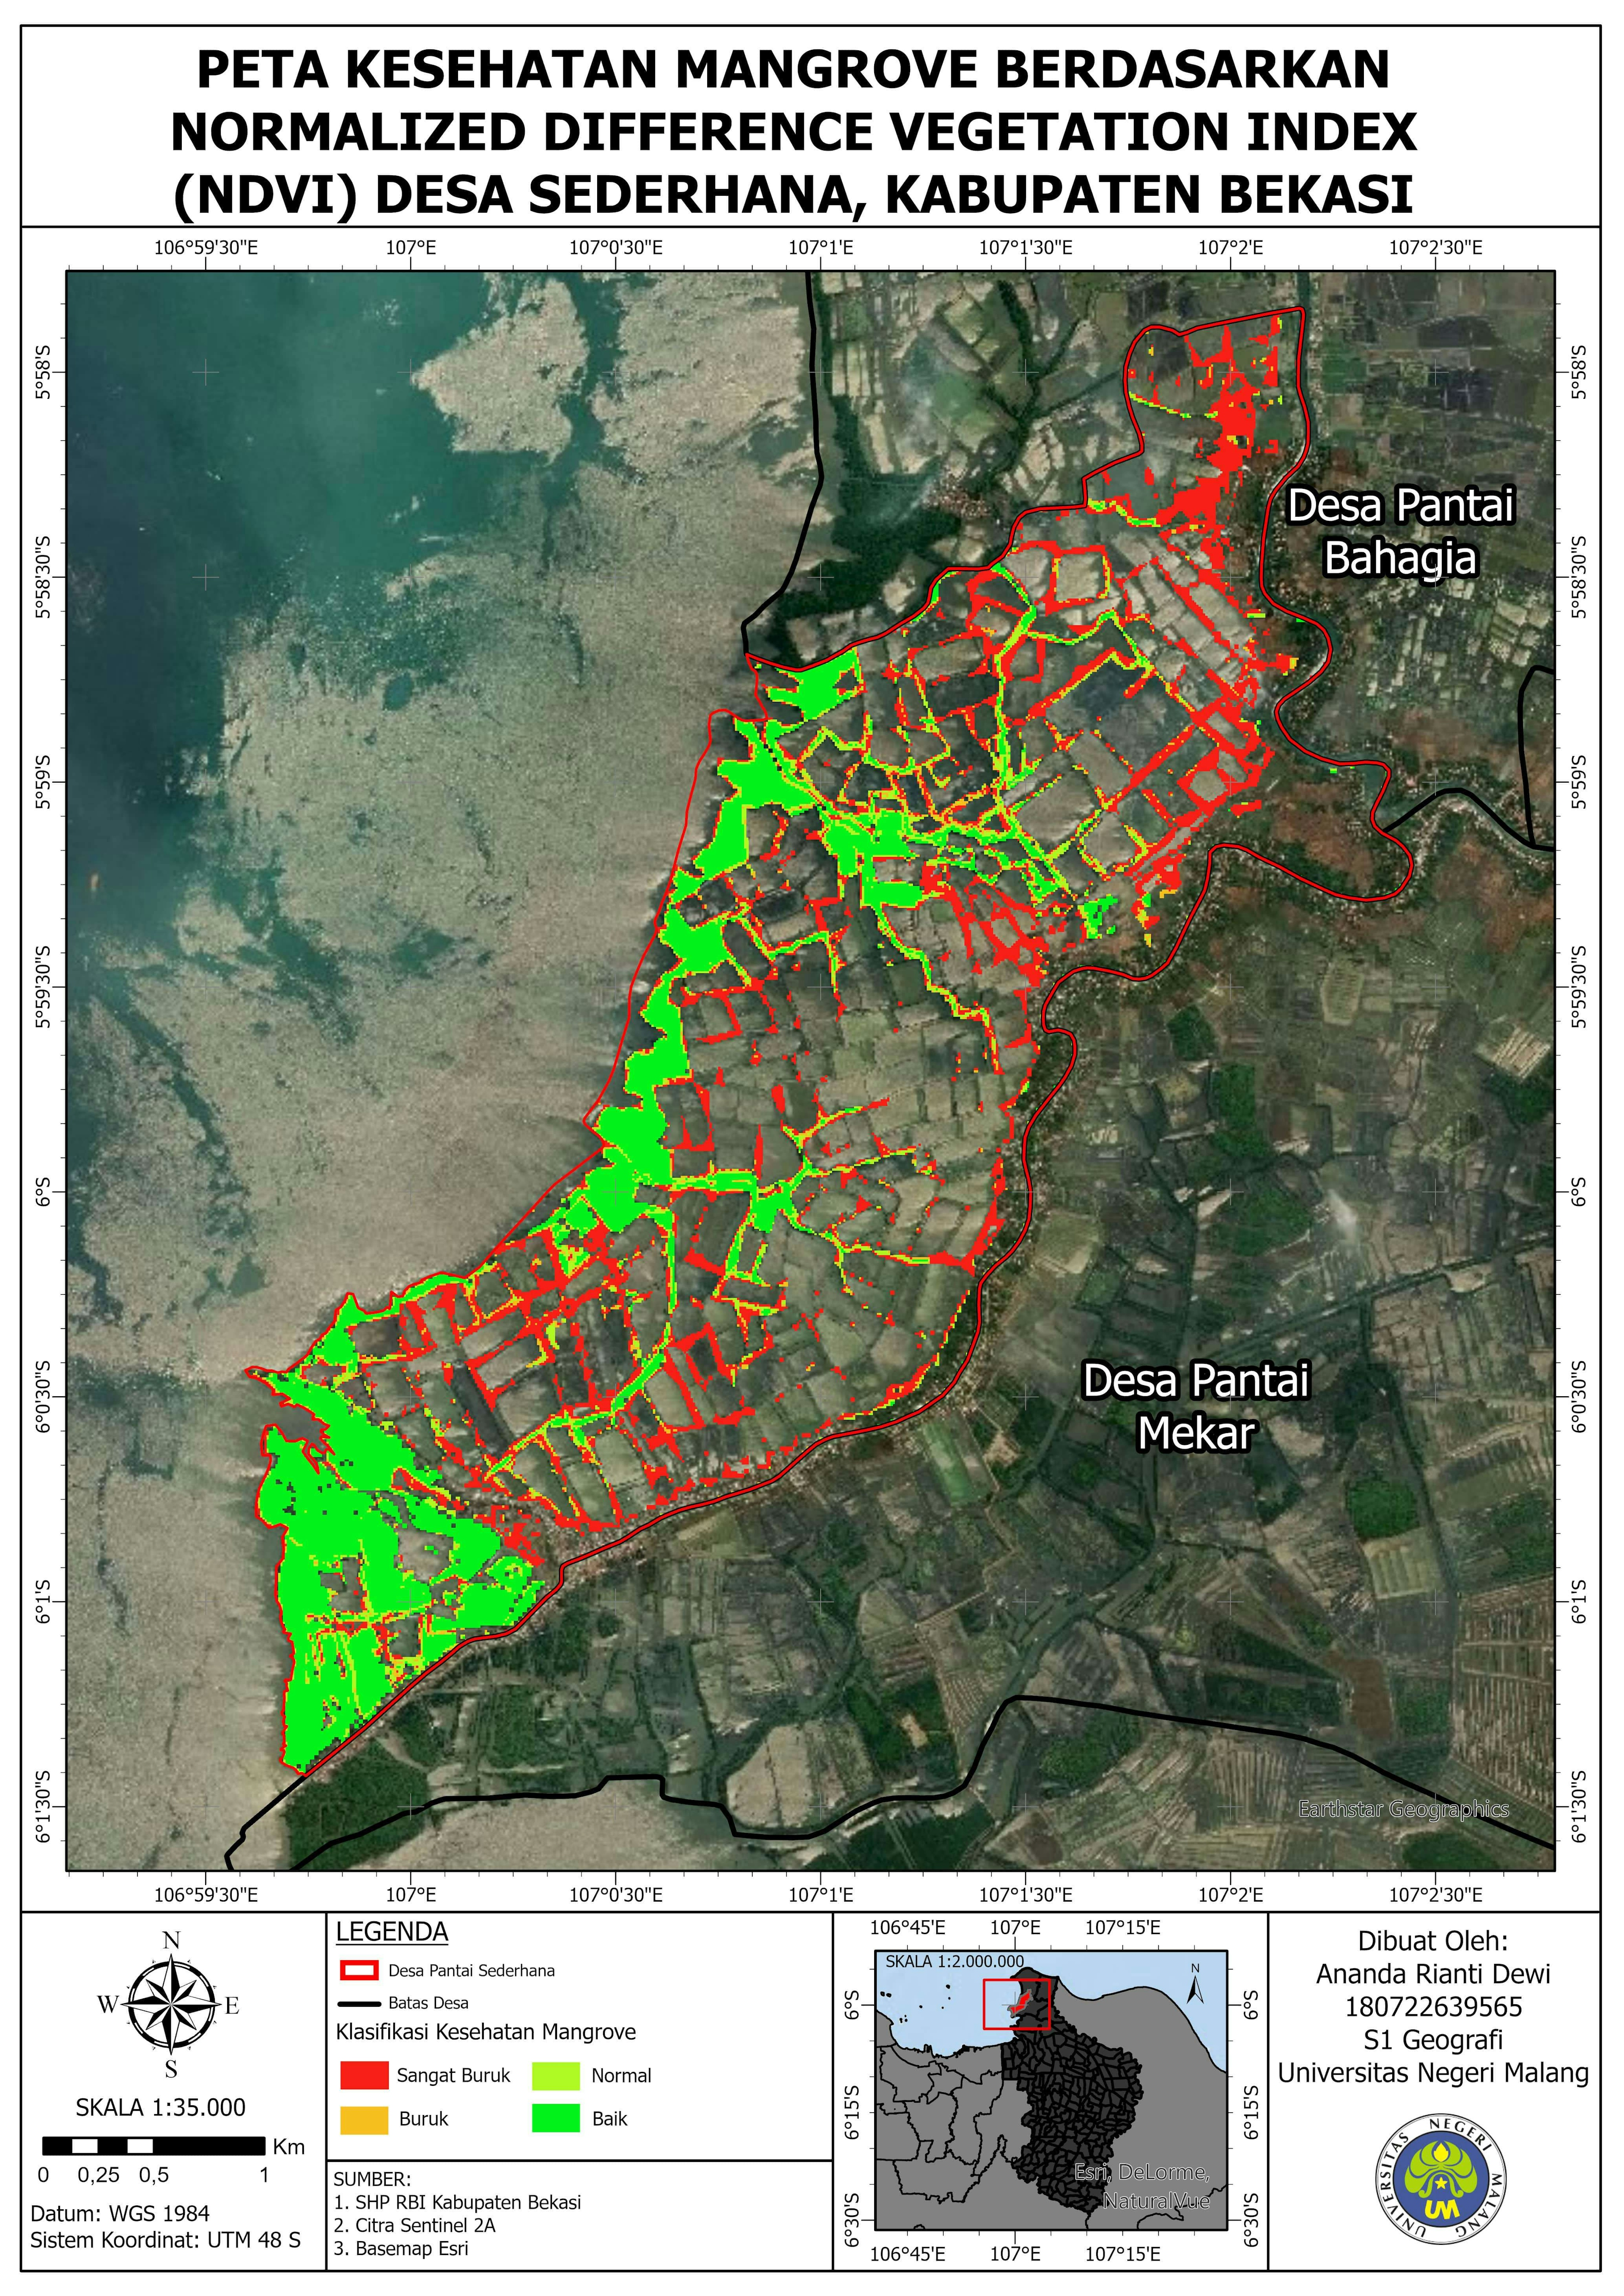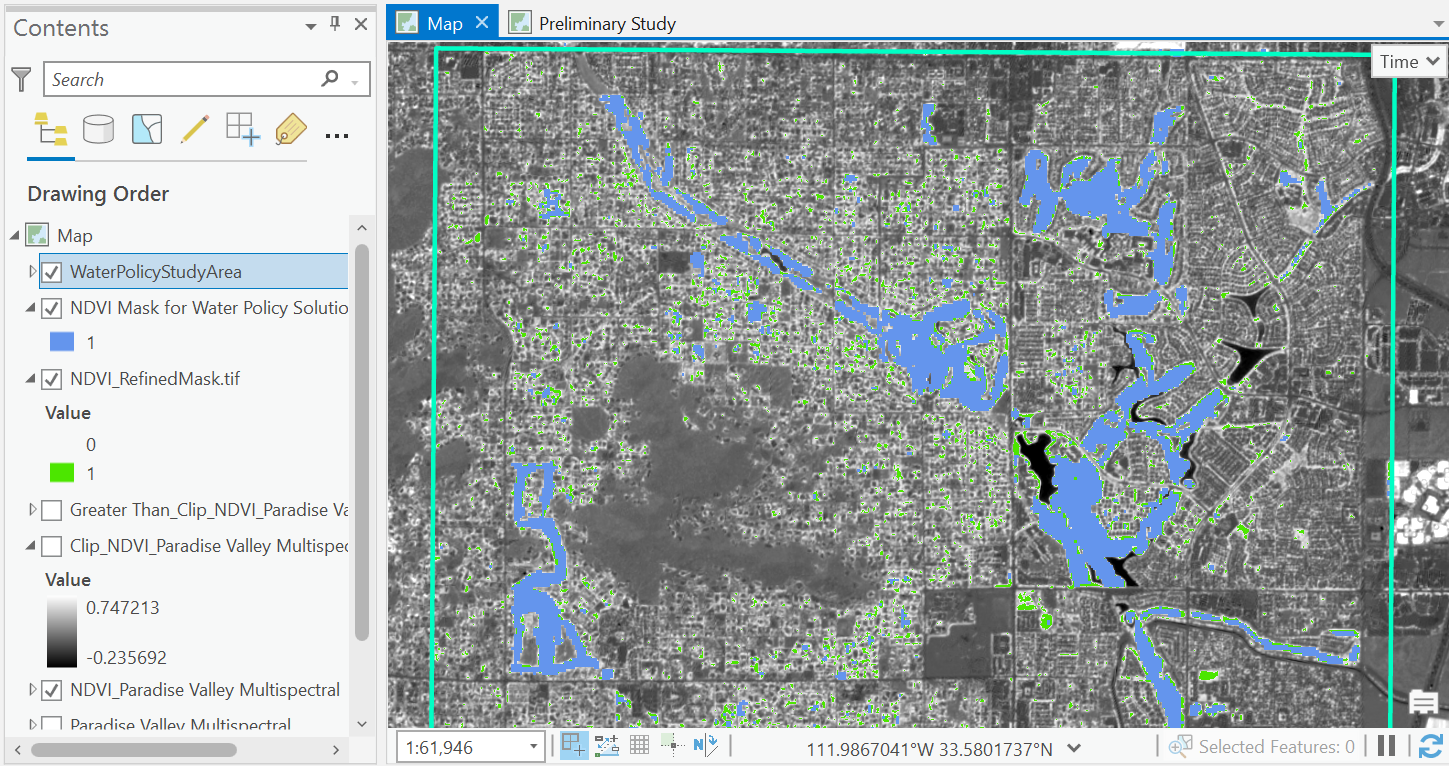
This project assessed multispectral imagery with the highest vegetation index values using an NDVI value threshold to understand vegetation area size that would be impacted by a potential change to the local water policy. This process required using remotely sensed data to map land cover types. I also learned about examining the quality of imagery resolution from differing satellite sensors and their consequences in feature detection.
My workflow is described below:
In ArcGIS Online
- Filter through open source raster datasets in ArcGIS Living Atlas and the Landsat Explorer App.
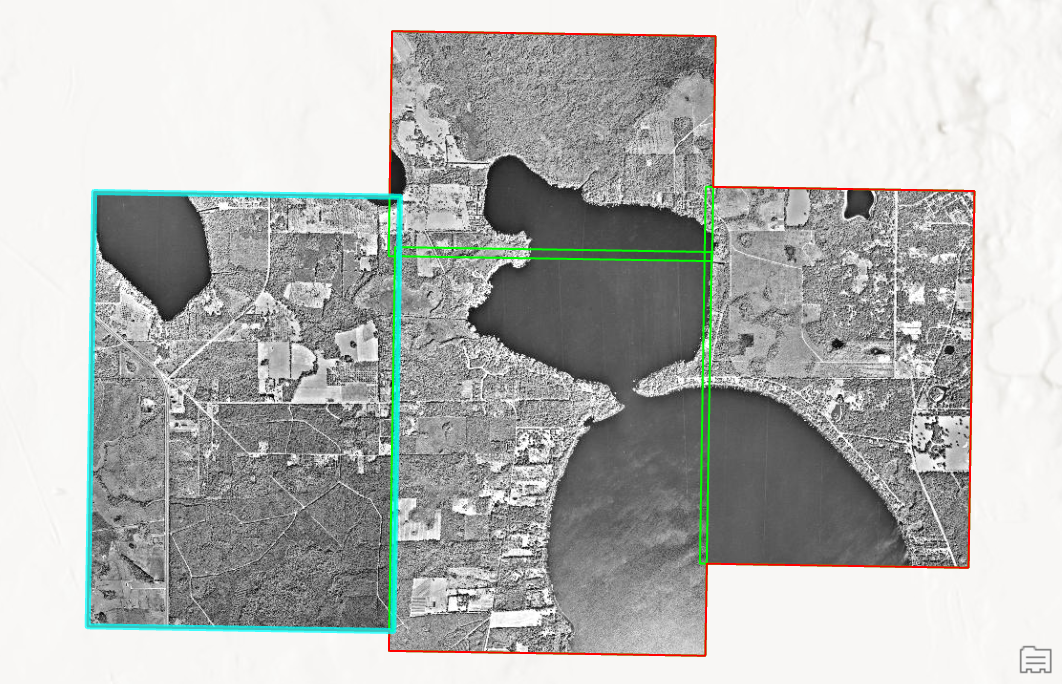
- Zoom to area of interest and adjust the renderer to display healthy vegetation with the Near Infrared band.
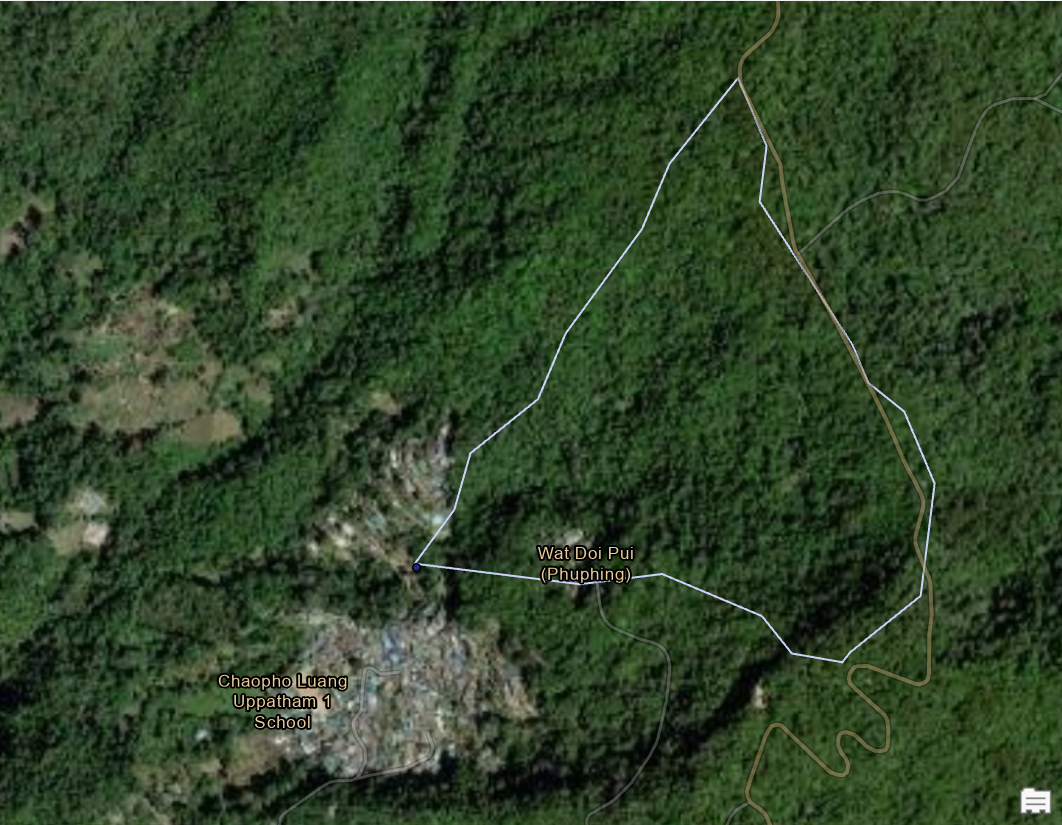
- Define an area of study.
- Set the renderer to Vegetation Index (NDVI).
- Create a vegetation mask to allow desired features to stand out.
- Create a study mask layer to measure proposed change.
- Ensure the correct processing template is used.
- Save masks and layers to organization.
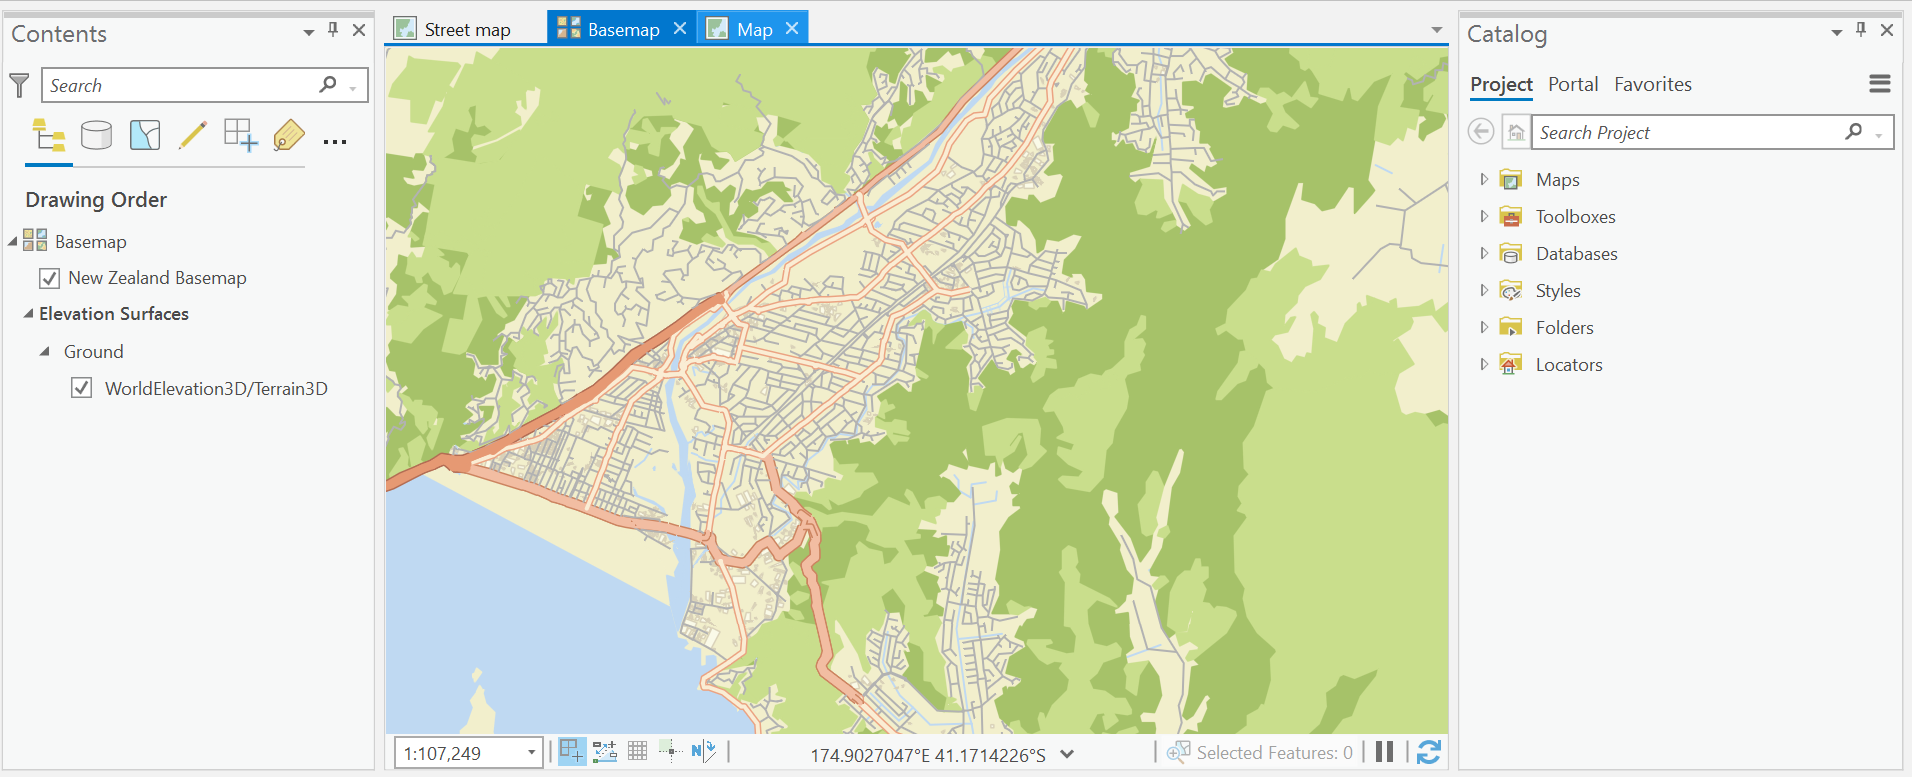
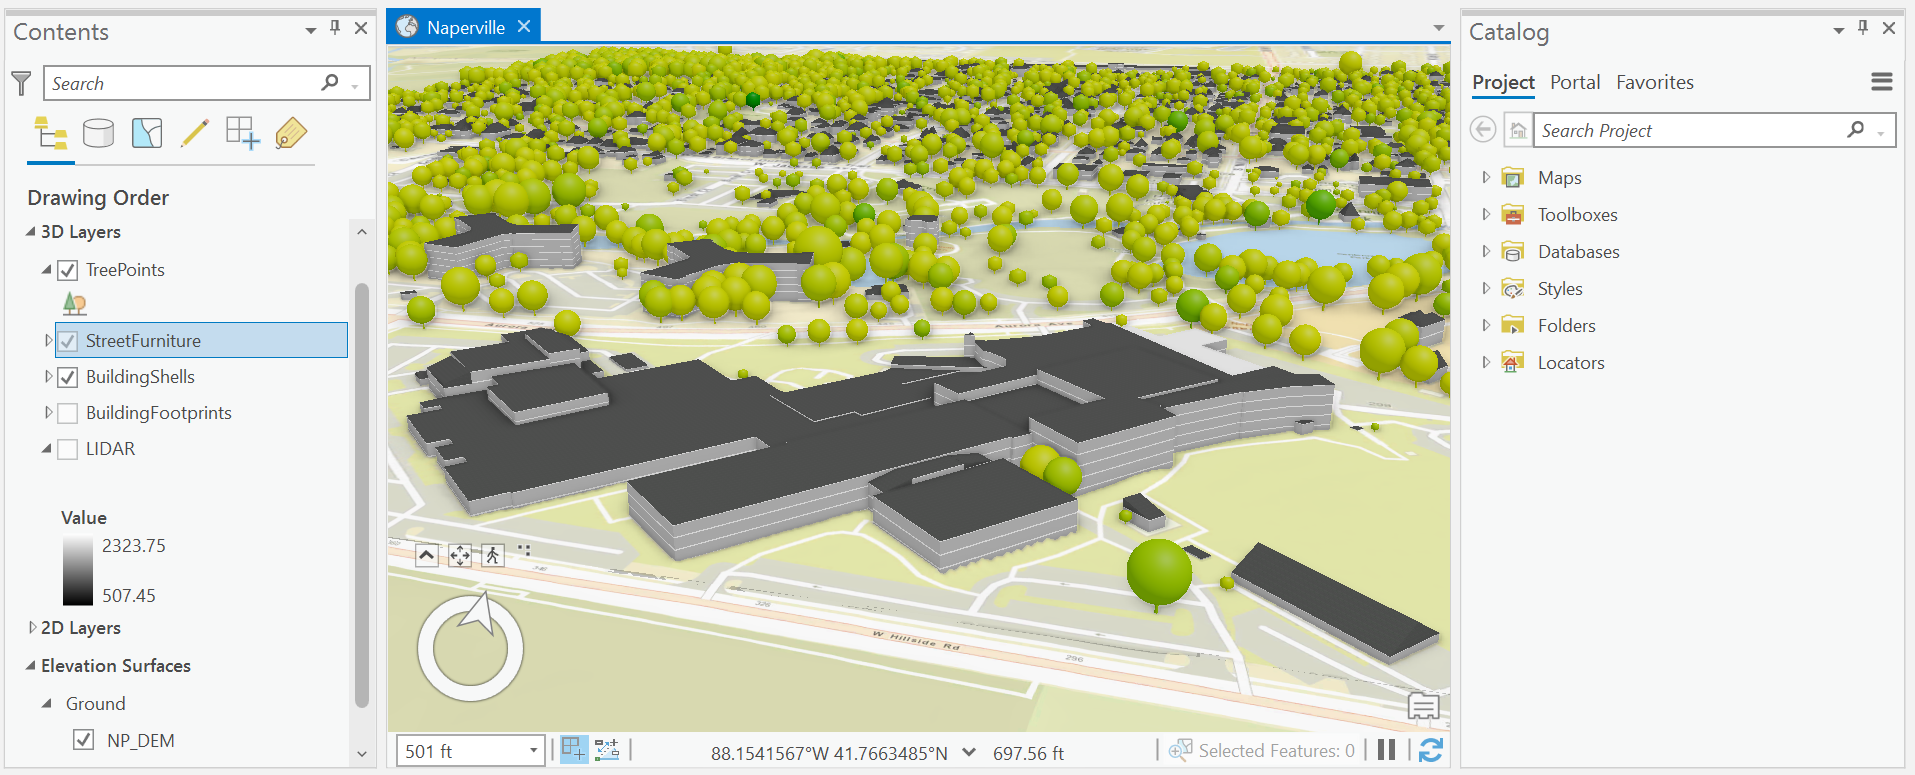
In ArcGIS Pro
- Import Satellite imagery.
- Add vegetation mask and study layer to map from the Catalog.
- Adjust rendering for the multipspectral imagery layer to Color Infrared.
- If the visualization is too bright, use the Dynamic Range Adjustment button.
- Create and NDVI layer by apply a Band Arithmetic raster function to the imagery layer.
- Use a raster function to clip the NDVI layer to study area extent and create a new layer.
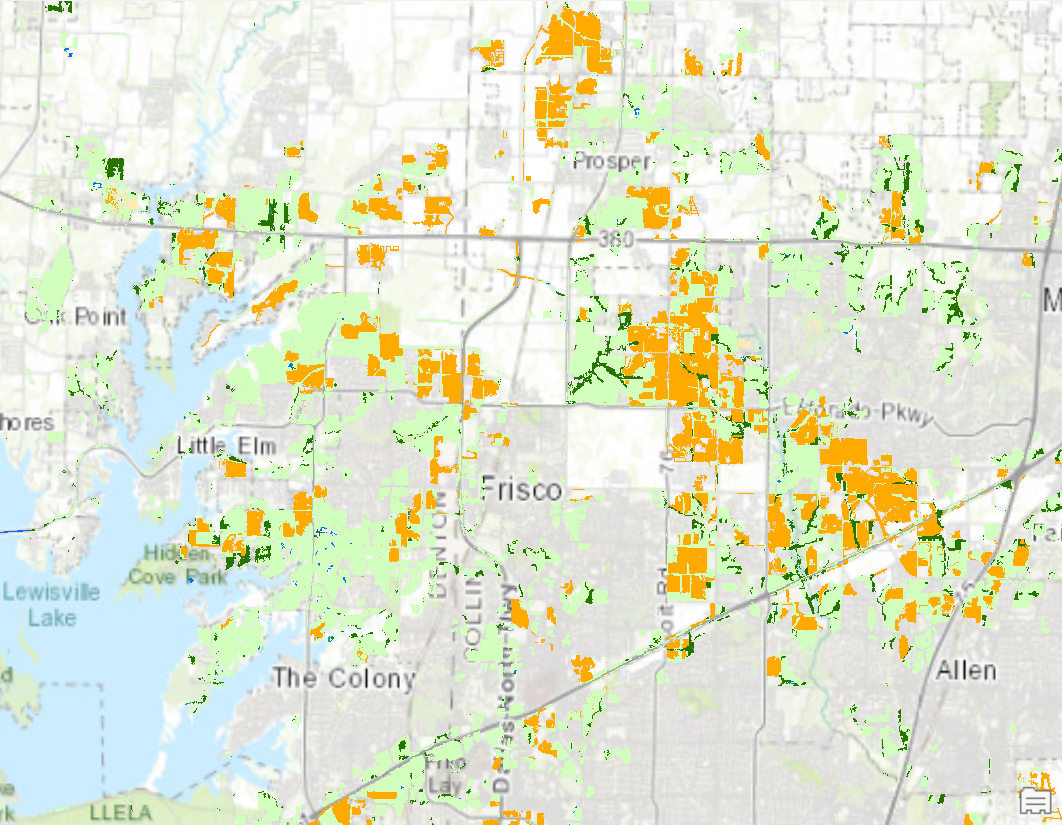
- Create a new mask with the Greater Than raster function to display areas exceeding the NDVI value threshold.
- Export the mask as a .tif file.
- Remove mask from contents pane.
- Generate a raster attribute table from the .tif file with the Build Raster Attribute Table geoprocessing tool.
- Add mask back to contents pane.
- Correct raster layer symbology changes from running the tool.
- Adjust drawing order to display mask overlaps.
Other tools used:
- Swipe
- Examine raster properties