Introduction: In my inaugural project in R, I embarked on a journey to leverage digital photogrammetry techniques for crop monitoring, specifically by computing the Normalized Difference Vegetation Index (NDVI) from drone images. The primary objective was to empower farmers with a powerful tool for assessing crop growth and yield over time. The utilization of NDVI allows for the identification of areas within the field where growth is suboptimal, facilitating timely interventions to optimize crop yields and reduce costs.
Project Overview:
Data Acquisition:
Acquired high-resolution drone images of the agricultural field, ensuring a comprehensive and detailed representation of the crop canopy.
Digital Photogrammetry:
Utilized digital photogrammetry techniques in R to process and reconstruct three-dimensional information from the drone images. This step laid the foundation for accurate and detailed analysis.
NDVI Computation:
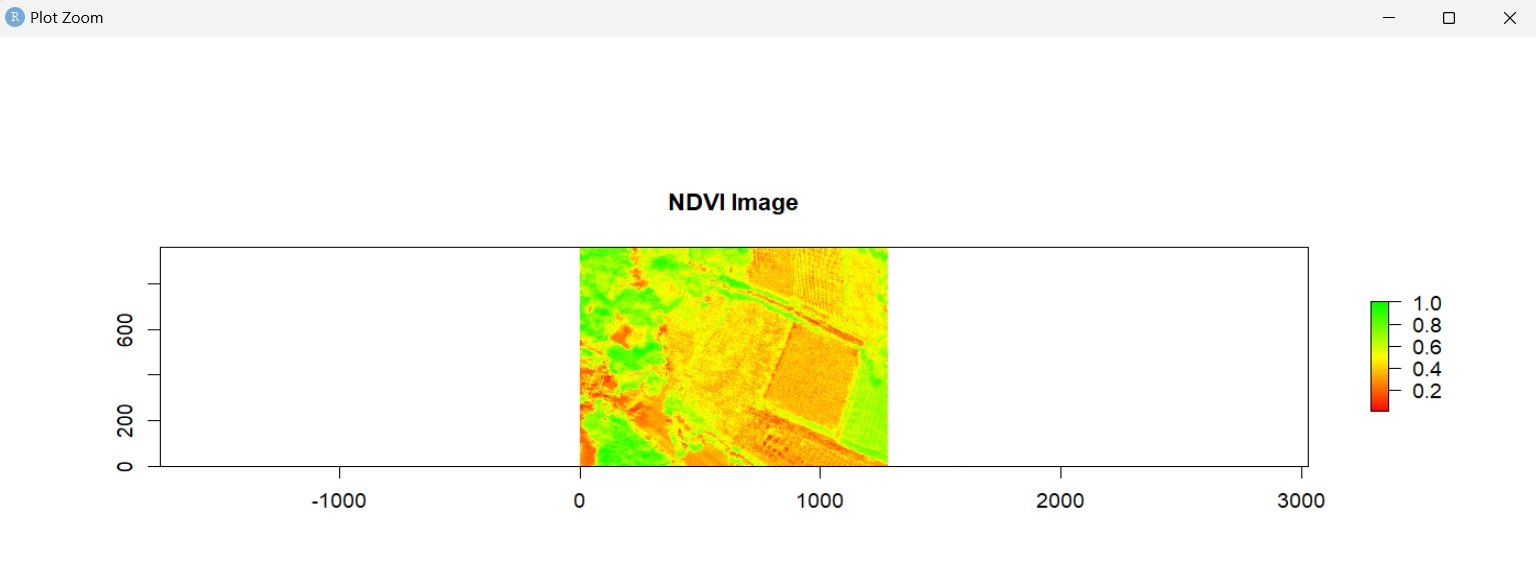
Computed the NDVI using R programming, a crucial vegetation index that provides insights into the health and vigor of crops. NDVI is calculated from the red and near-infrared bands of the electromagnetic spectrum, offering a quantitative measure of vegetation density.
Temporal Analysis:
Implemented a temporal analysis by computing NDVI over multiple time points. This allowed for the monitoring of crop growth dynamics, enabling the identification of growth trends and patterns throughout the growing season.
Visualization:
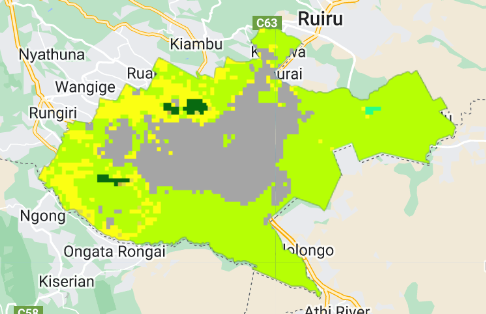
Developed visualizations, such as NDVI maps and time-series plots, to present the spatial and temporal variation in crop health. These visual aids provide an intuitive understanding of crop growth dynamics for farmers and other stakeholders.
Benefits and Significance:
Precision Agriculture:
The utilization of drone imagery and NDVI computation enables precision agriculture, allowing farmers to make informed decisions based on specific insights into the variability of crop health within the field.
Timely Interventions:
By monitoring NDVI over time, farmers can identify areas of poor crop growth early in the season. This empowers them to take timely actions, such as adjusting irrigation, applying fertilizers, or addressing pest infestations, to optimize crop yields.
Cost Reduction:
The proactive identification of areas with poor crop growth allows for targeted interventions, reducing the need for blanket applications of resources. This, in turn, optimizes resource utilization and minimizes unnecessary costs.
Data-Driven Decision-Making:
The project promotes data-driven decision-making by providing farmers with actionable insights derived from the analysis of NDVI data. This empowers them to make informed choices for crop management.
Conclusion: This project represents a significant step toward harnessing the potential of digital photogrammetry and NDVI computation in agriculture. By monitoring crop growth and yield over time, farmers can proactively address challenges, optimize resource allocation, and ultimately enhance the overall productivity of their fields.


![Lexical Map of [Shovel] in Malay Lang](/_next/image?url=https%3A%2F%2Fstorage.googleapis.com%2Fspatialnodefiles%2Fprojects%2FPetaDialekCangkul1_9000385.png&w=3840&q=100)


.svg "Keran Nkongolo")