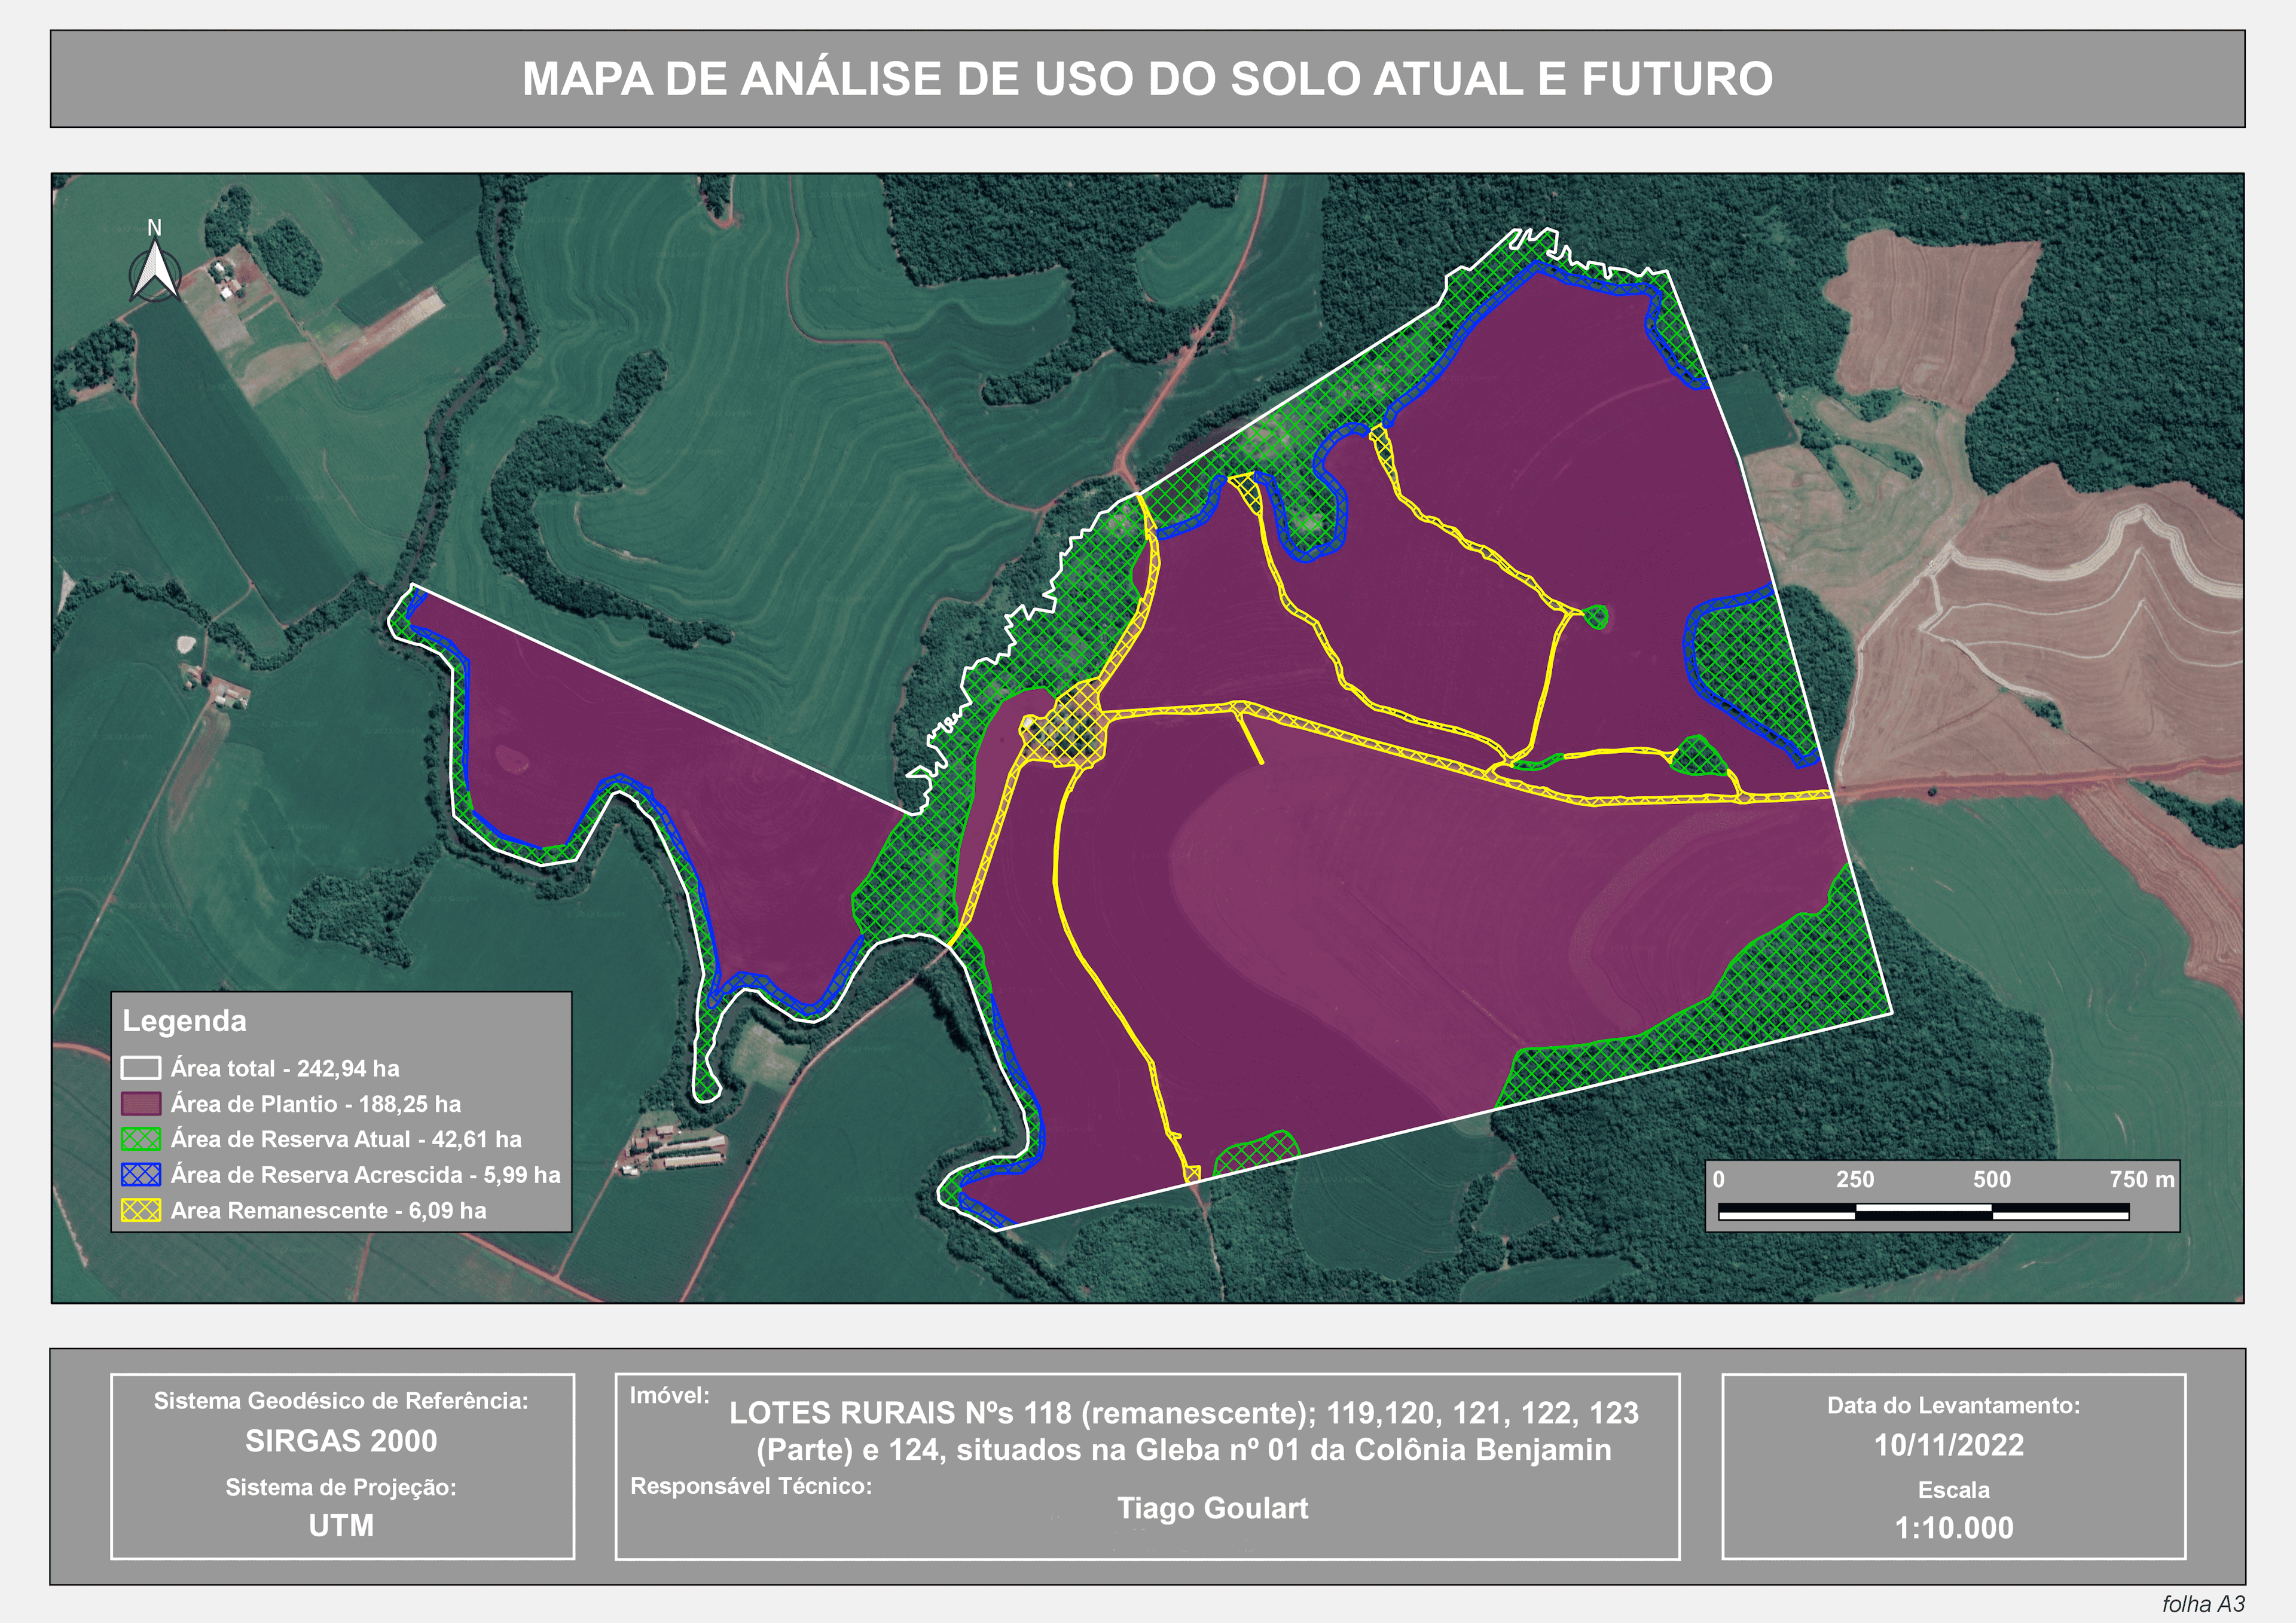
This map represents planting areas, current legal reserves, increased legal reserves, and the total area, all divided by a well-defined color legend. This analysis was used to illustrate the environmental compensation required for the farmer to comply with the environmental agency's guidelines.
To create this map, we utilized the QGIS software, incorporating vector data from the Rural Environmental Registry (Cadastro Ambiental Rural - CAR). The process involved several key steps:
Data Collection: We collected and integrated spatial data from various sources, including satellite imagery, GPS data, and shapefiles provided by the CAR.
Data Preparation: We processed the data to ensure consistency and accuracy. This included georeferencing, attribute table adjustments, and quality control.
Analysis: Using QGIS, we conducted spatial analysis to determine planting areas and legal reserves. This involved overlaying land cover data with legal reserve boundaries and calculating the areas for each category.
Color Legend: We designed a color legend to visually represent the different categories, making it easier to interpret the map.
Final Map Creation: The final map was generated in QGIS, incorporating all the analyzed data and using the designed legend. Each color on the map corresponds to a specific category, providing a clear visual representation of the planting areas and legal reserves.
This map serves as a valuable tool for both environmental compliance assessment and land management, helping farmers understand and fulfill their environmental responsibilities while optimizing land use.