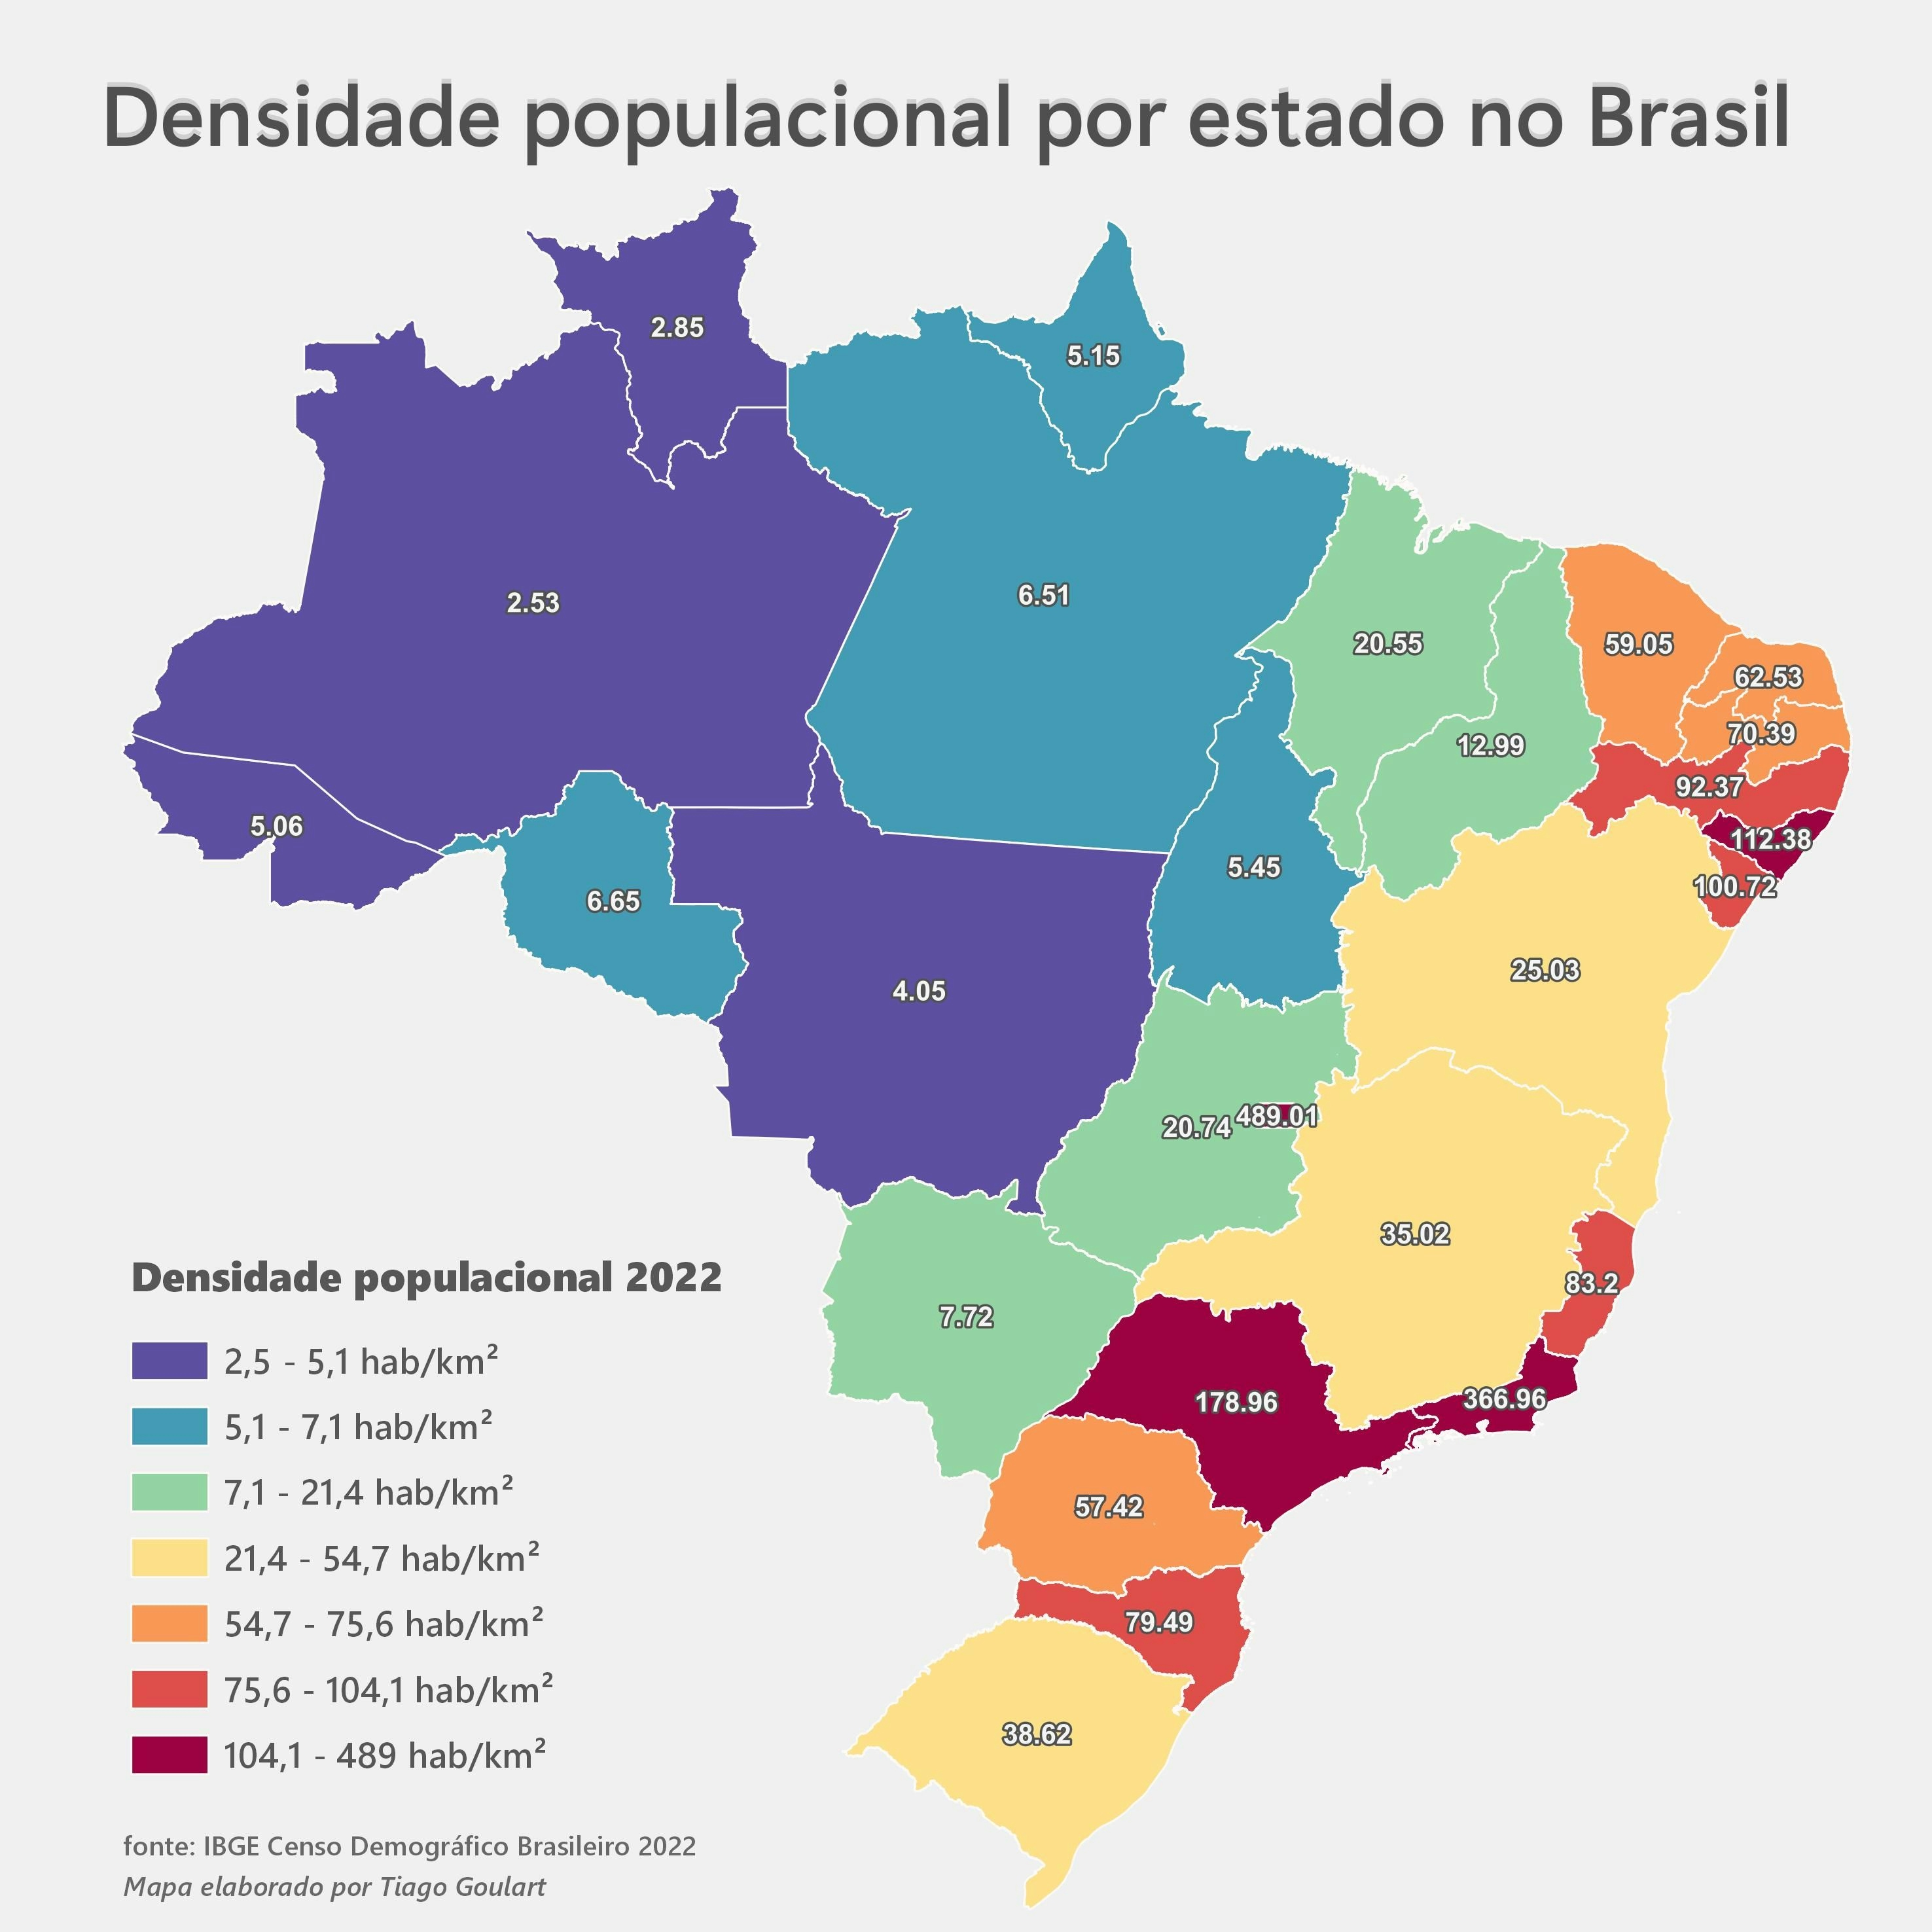
Using data from the 2022 Brazilian Demographic Census provided by IBGE, I have created a map illustrating population density ranges for each Brazilian state. This was accomplished by utilizing the attribute table in QGIS, which contained information on each state's area in square kilometers and its population. Consequently, population density values in inhabitants per square kilometer were derived.
This map provides valuable insights into how states such as São Paulo, Rio de Janeiro, and Brasília, owing to their significant economic importance, exhibit high population density. Conversely, states like Amazonas, Roraima, and Mato Grosso demonstrate lower population concentrations per unit area. This phenomenon can be attributed to extensive forested areas and large agricultural estates.
The methodology involved in creating this map involved geospatial analysis and data manipulation techniques. Specifically, it included geoprocessing tasks to calculate population density by dividing the total population by the land area of each state. Visualization was achieved through thematic mapping, where colors and ranges were chosen to represent different population density levels. The resulting map serves as a powerful tool for understanding demographic patterns and regional disparities within Brazil.


.svg "Keran Nkongolo")