Data Collection: I gathered data from public platforms, focusing on information related to landfill sites across Brazilian states.
Data Filtering and Preparation: After collecting the data, I meticulously filtered and prepared it, ensuring it was clean and ready for analysis.
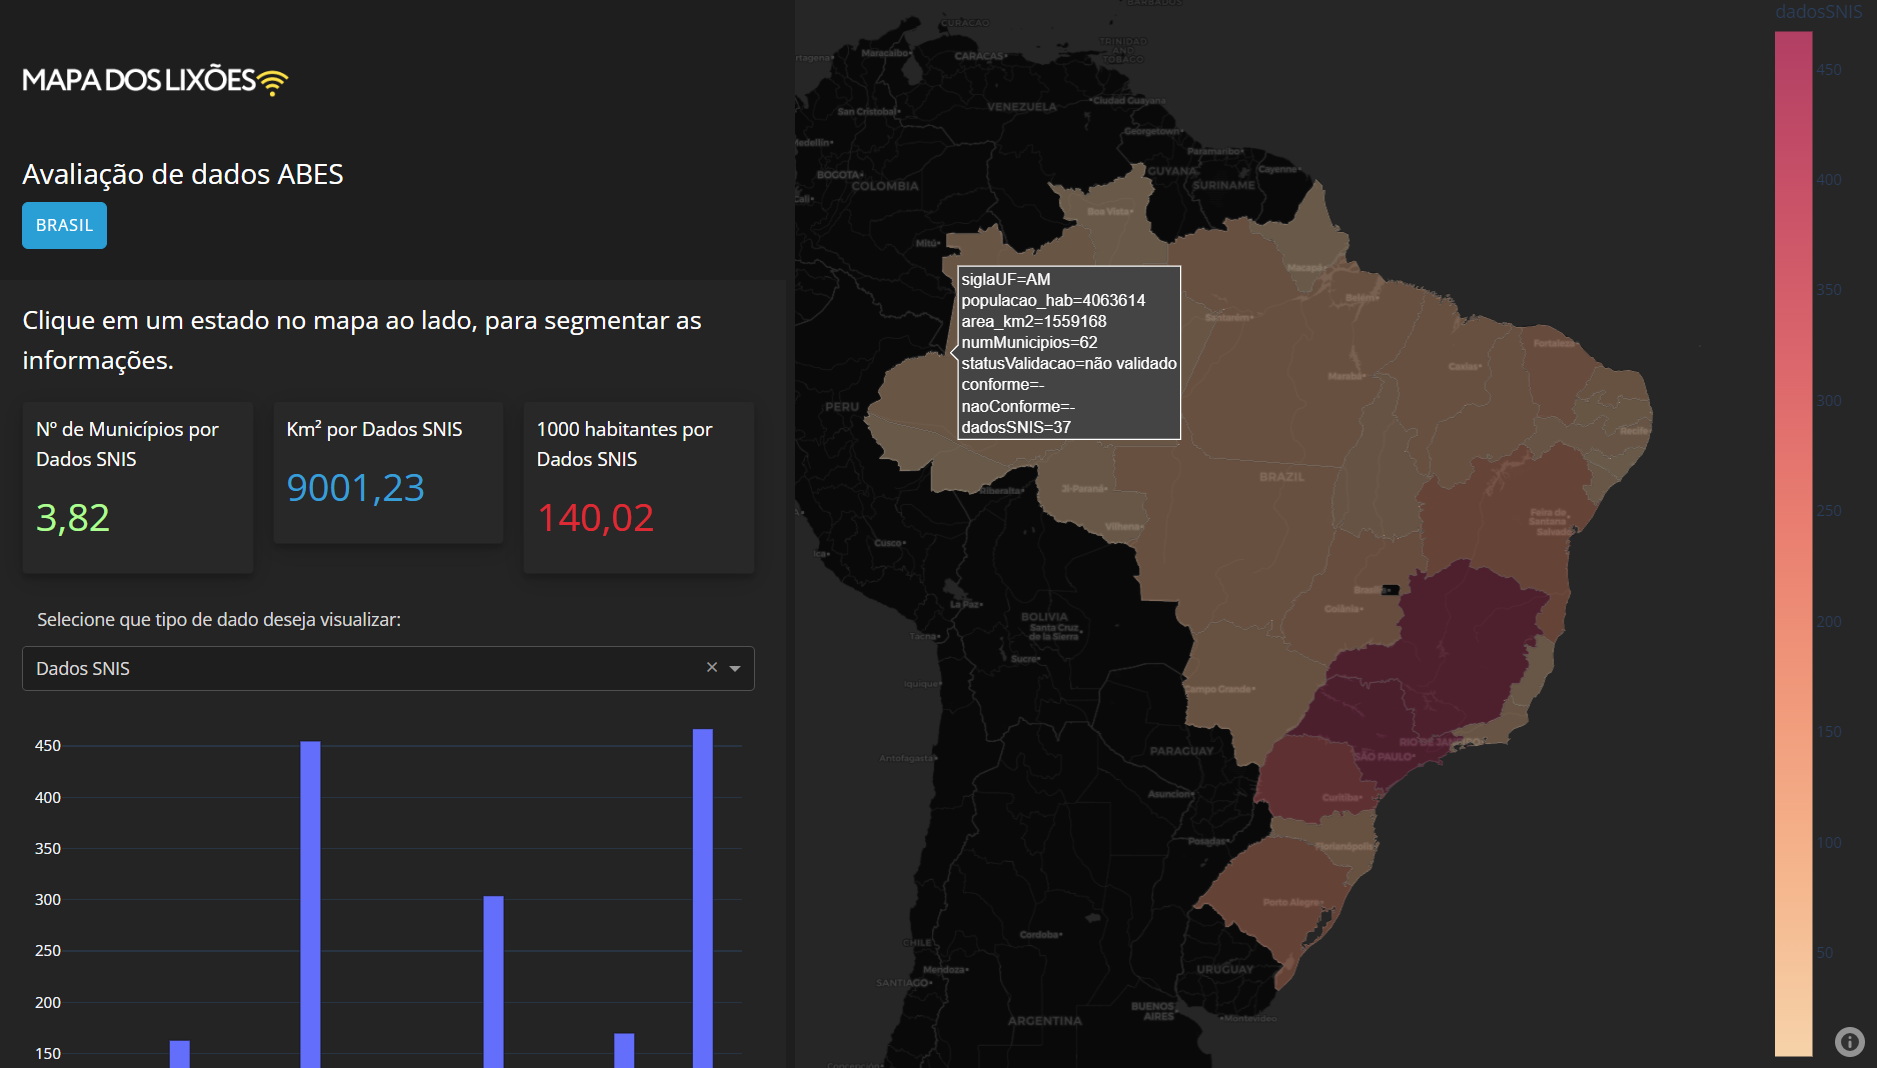
Interface Development: I developed Python code to create an interactive interface that quantifies landfill sites in each state and classifies key indicators, addressing the issue of landfills in Brazil.
Local Testing: The project was rigorously tested in a local environment to ensure its functionality and accuracy.
In summary, I collected, filtered, and prepared data from public sources, then developed a Python interface to quantify landfill sites and assess relevant indicators, addressing landfill issues in Brazil. The project underwent thorough local testing to guarantee its reliability and effectiveness.