
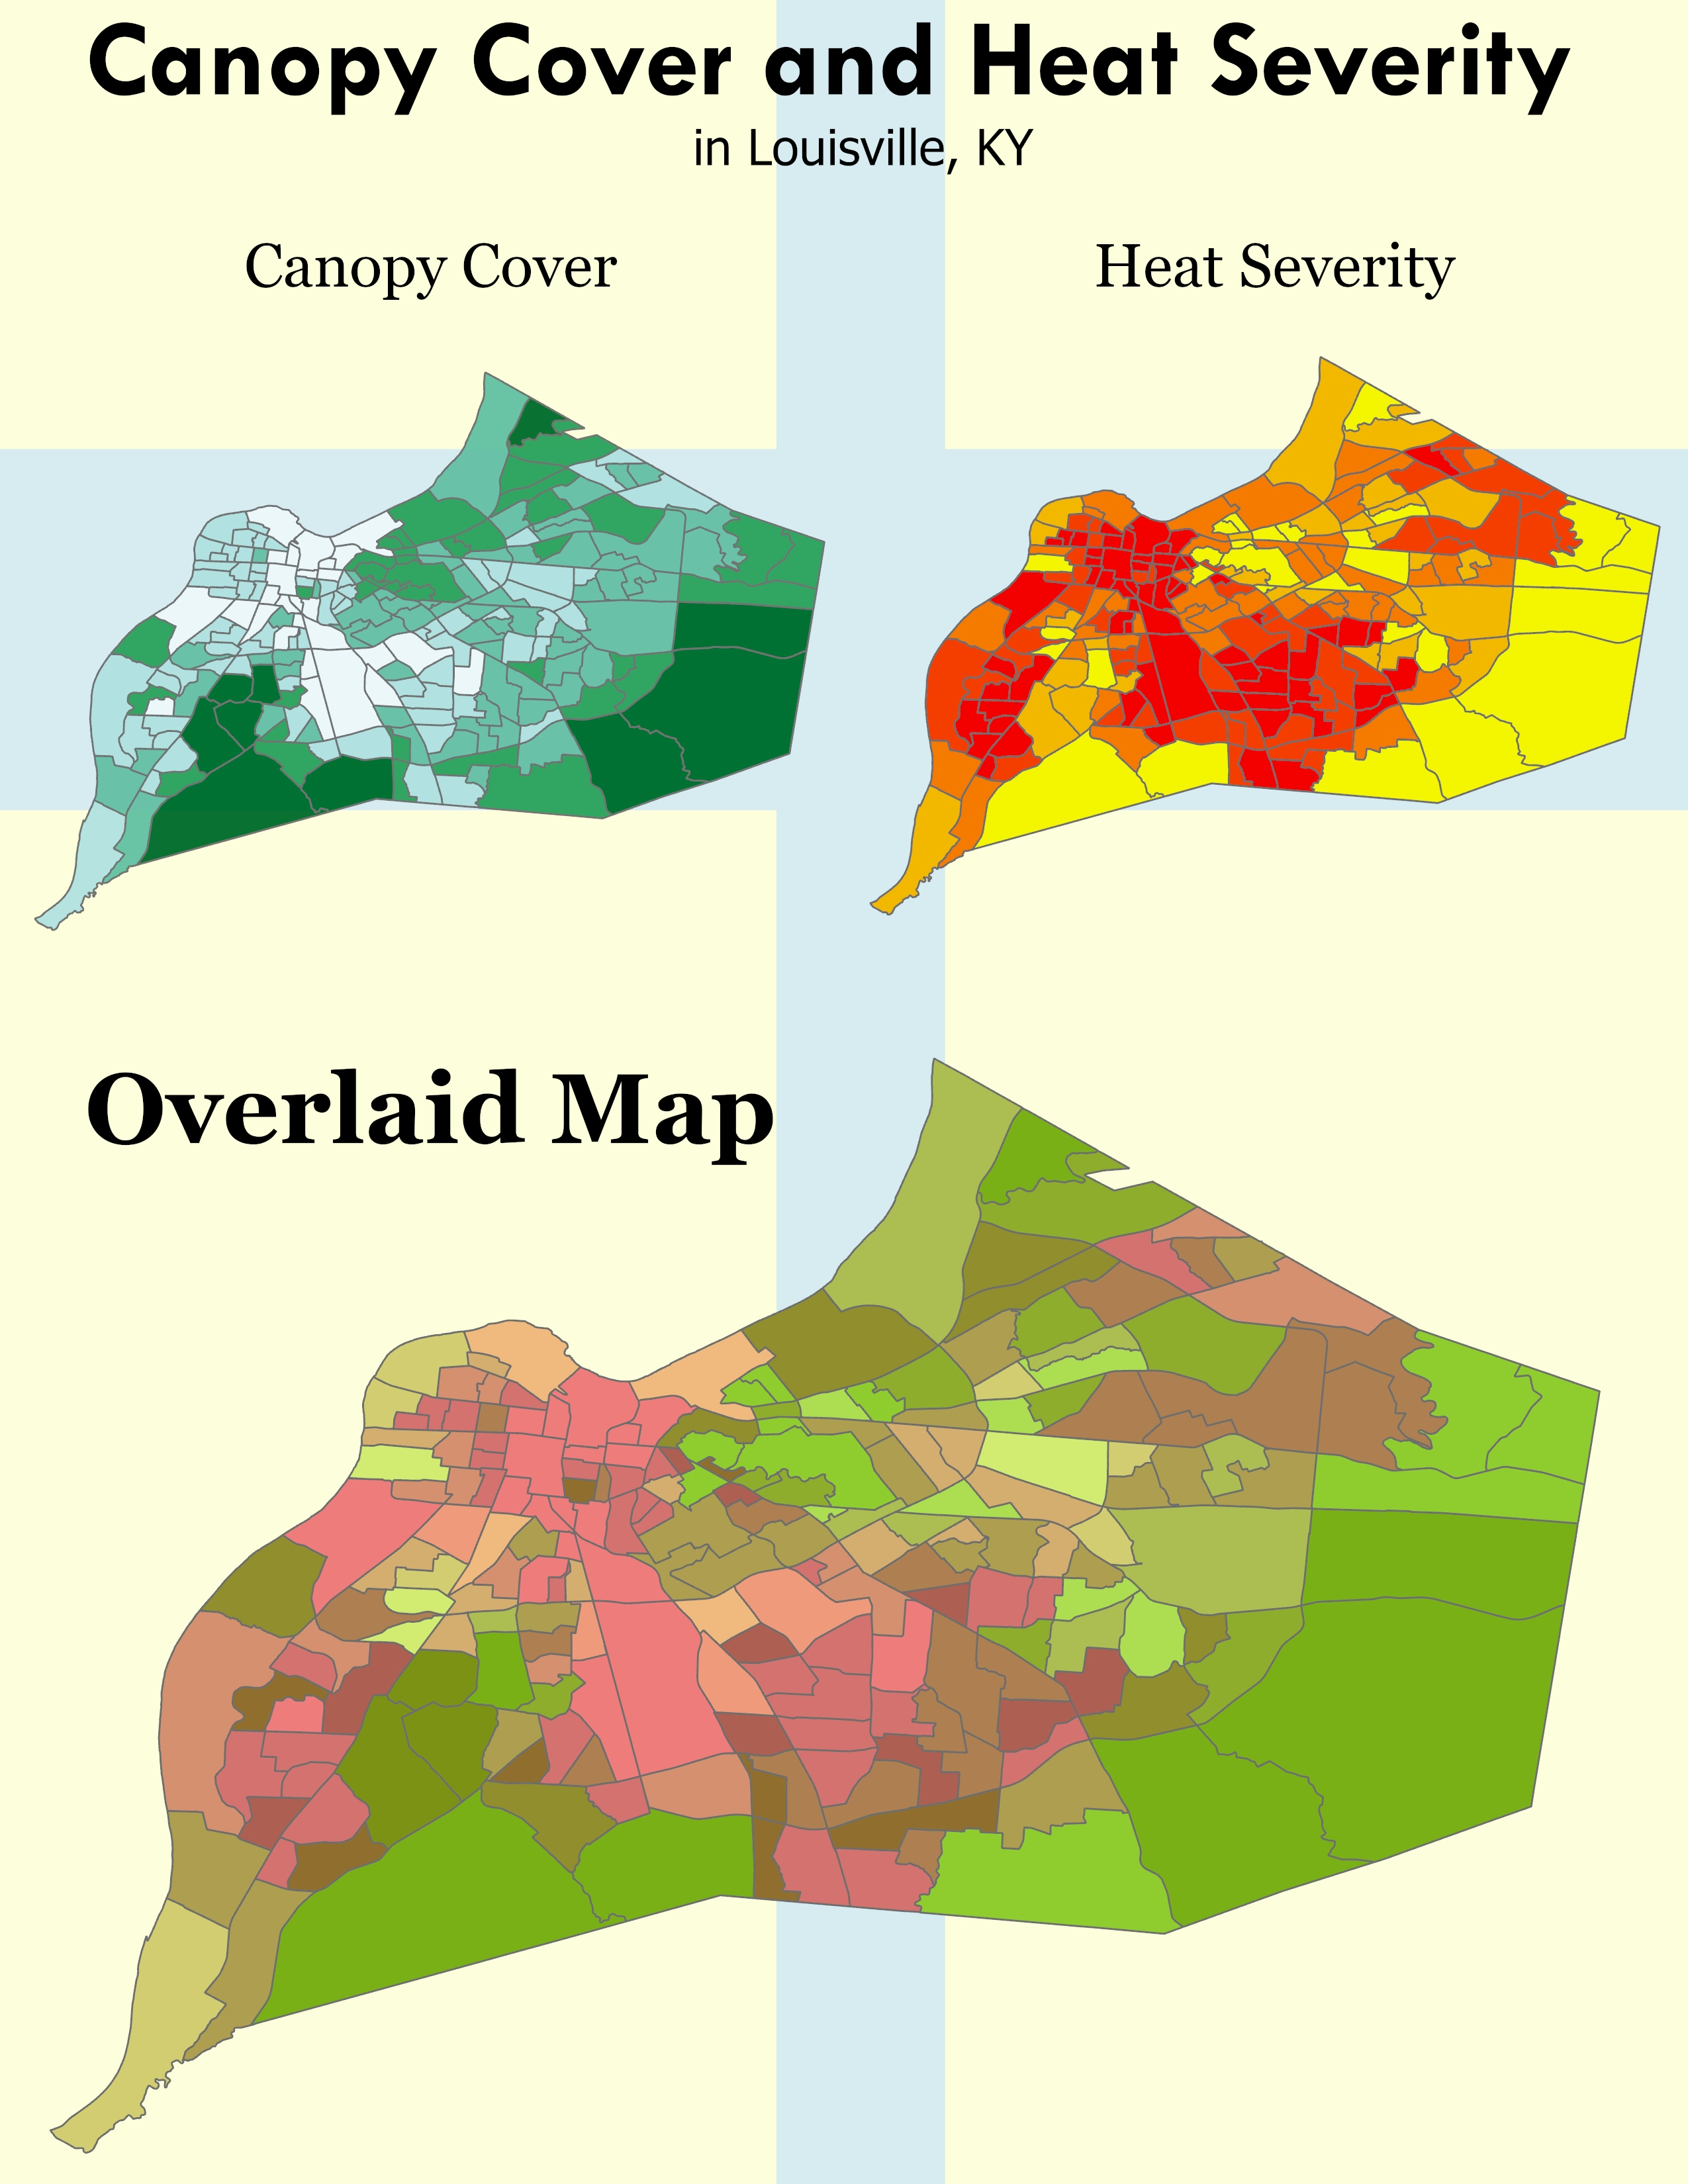
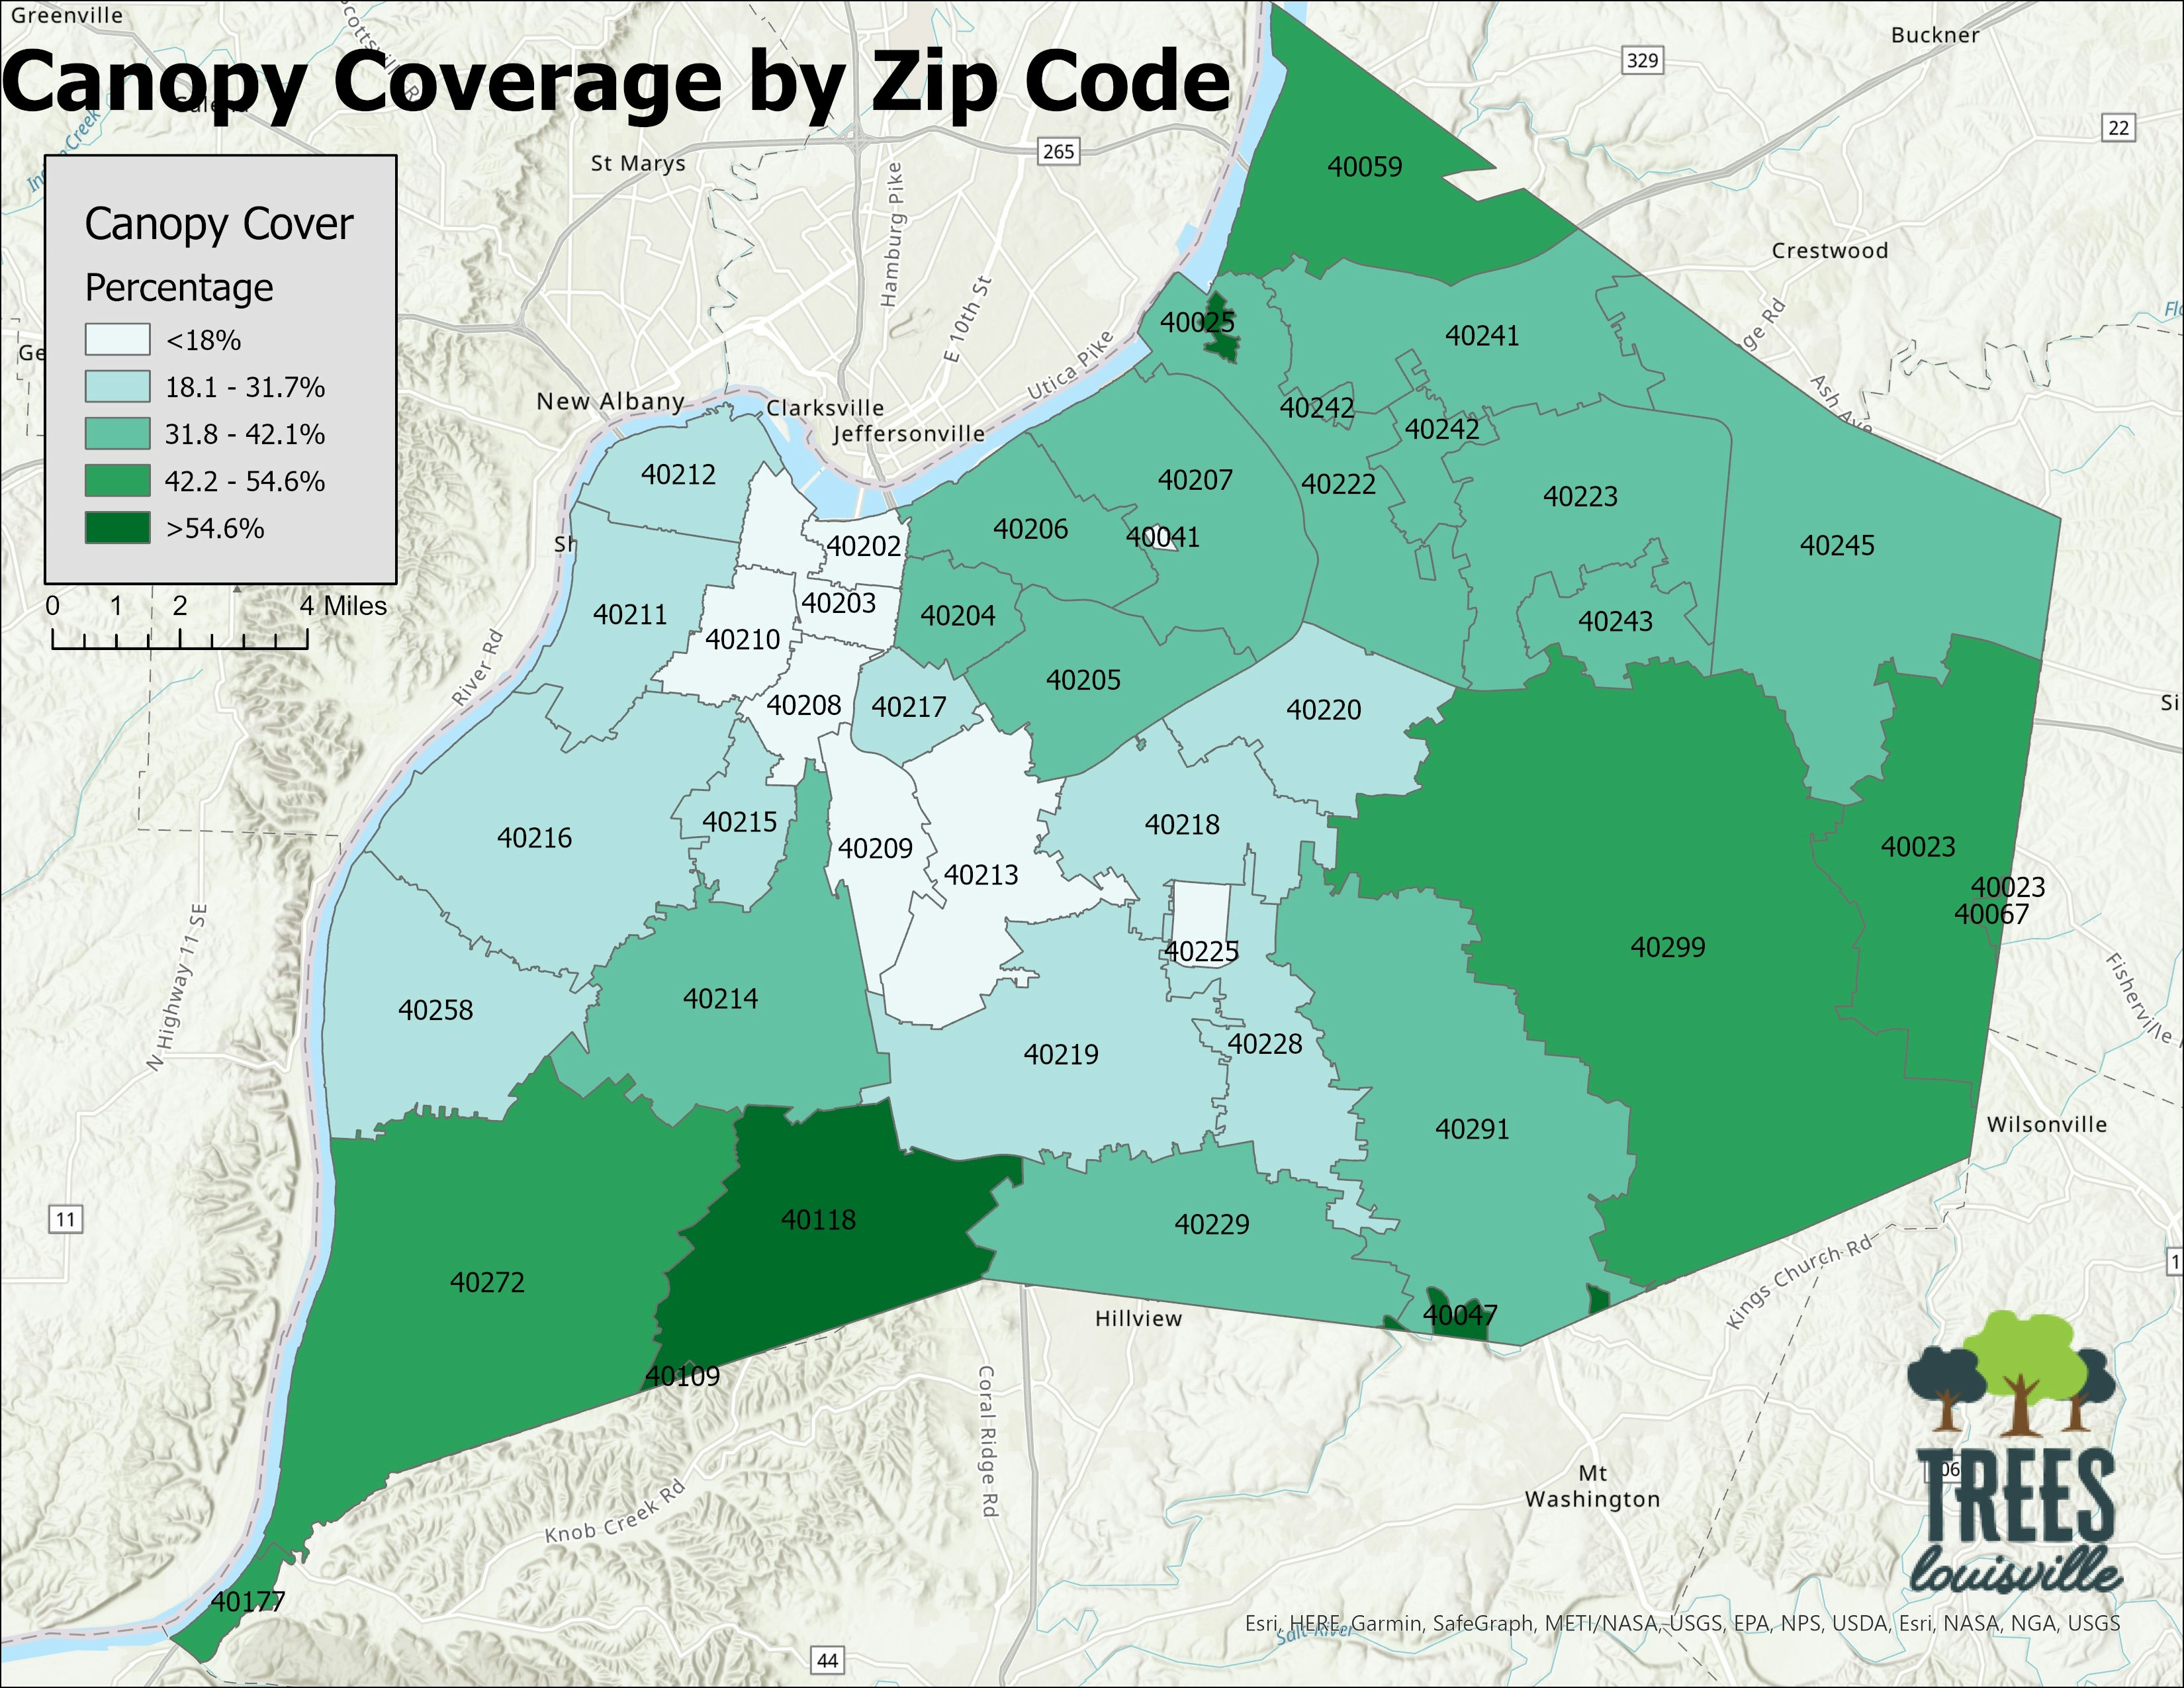
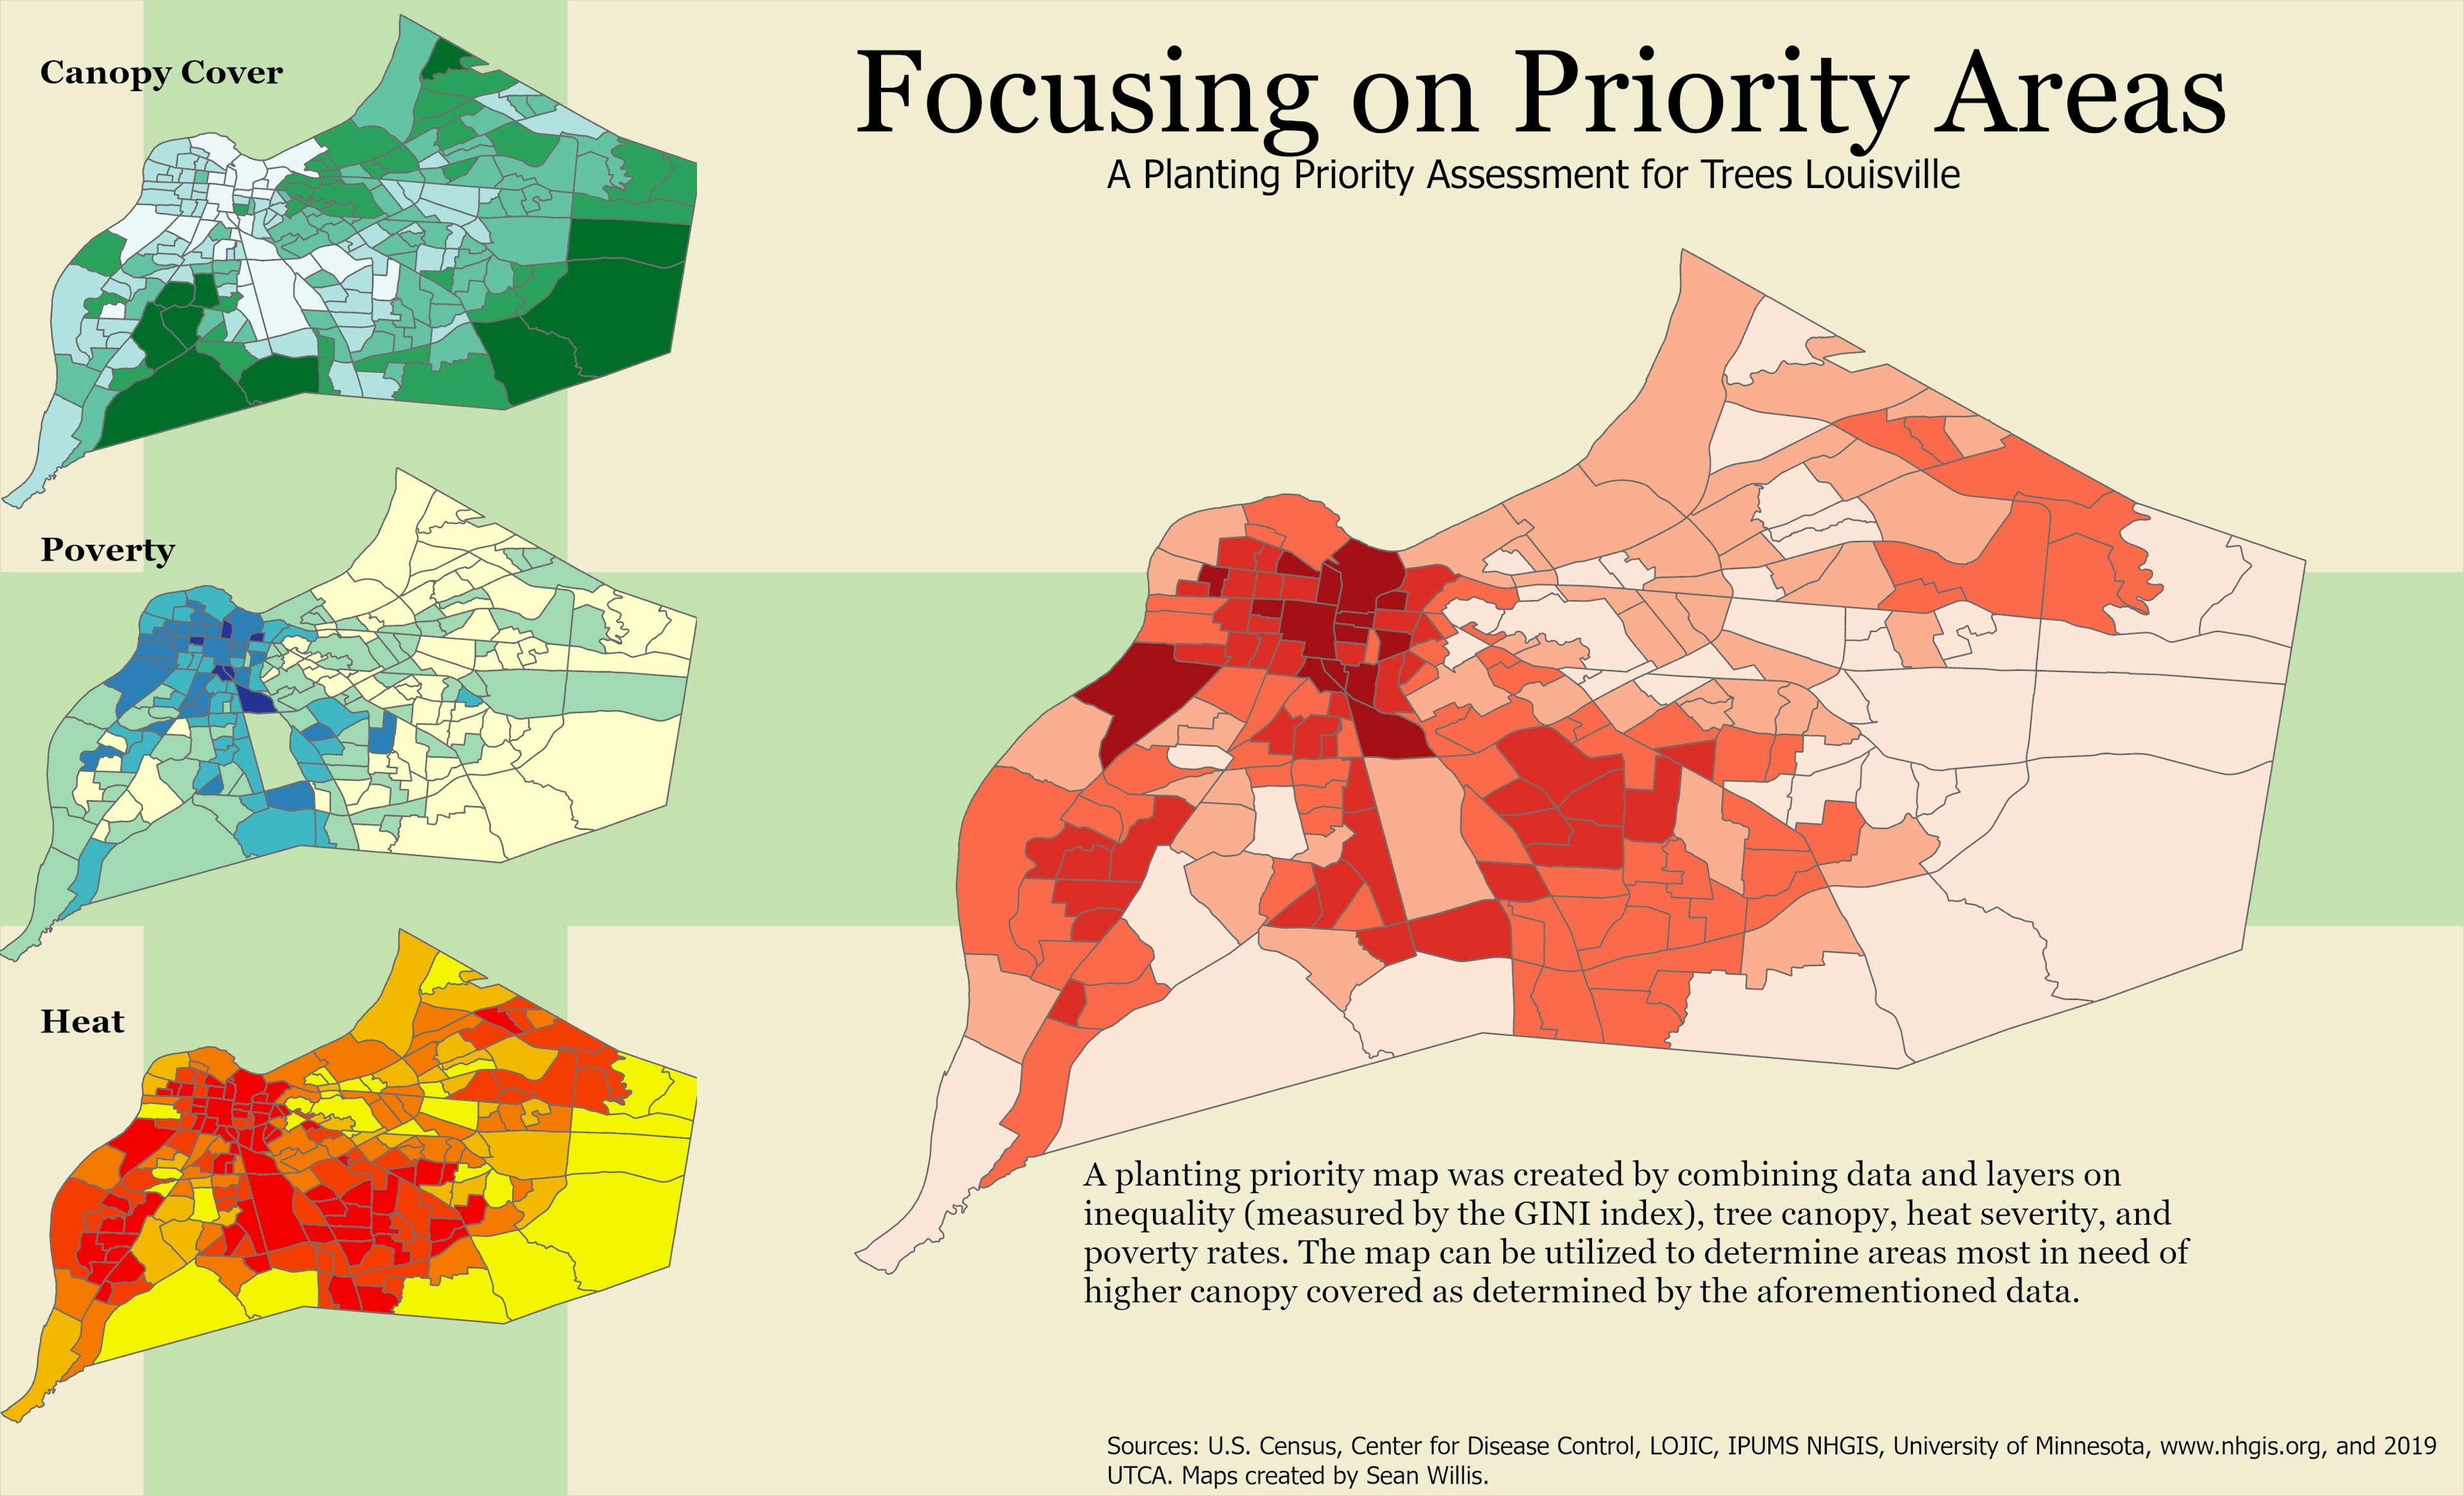
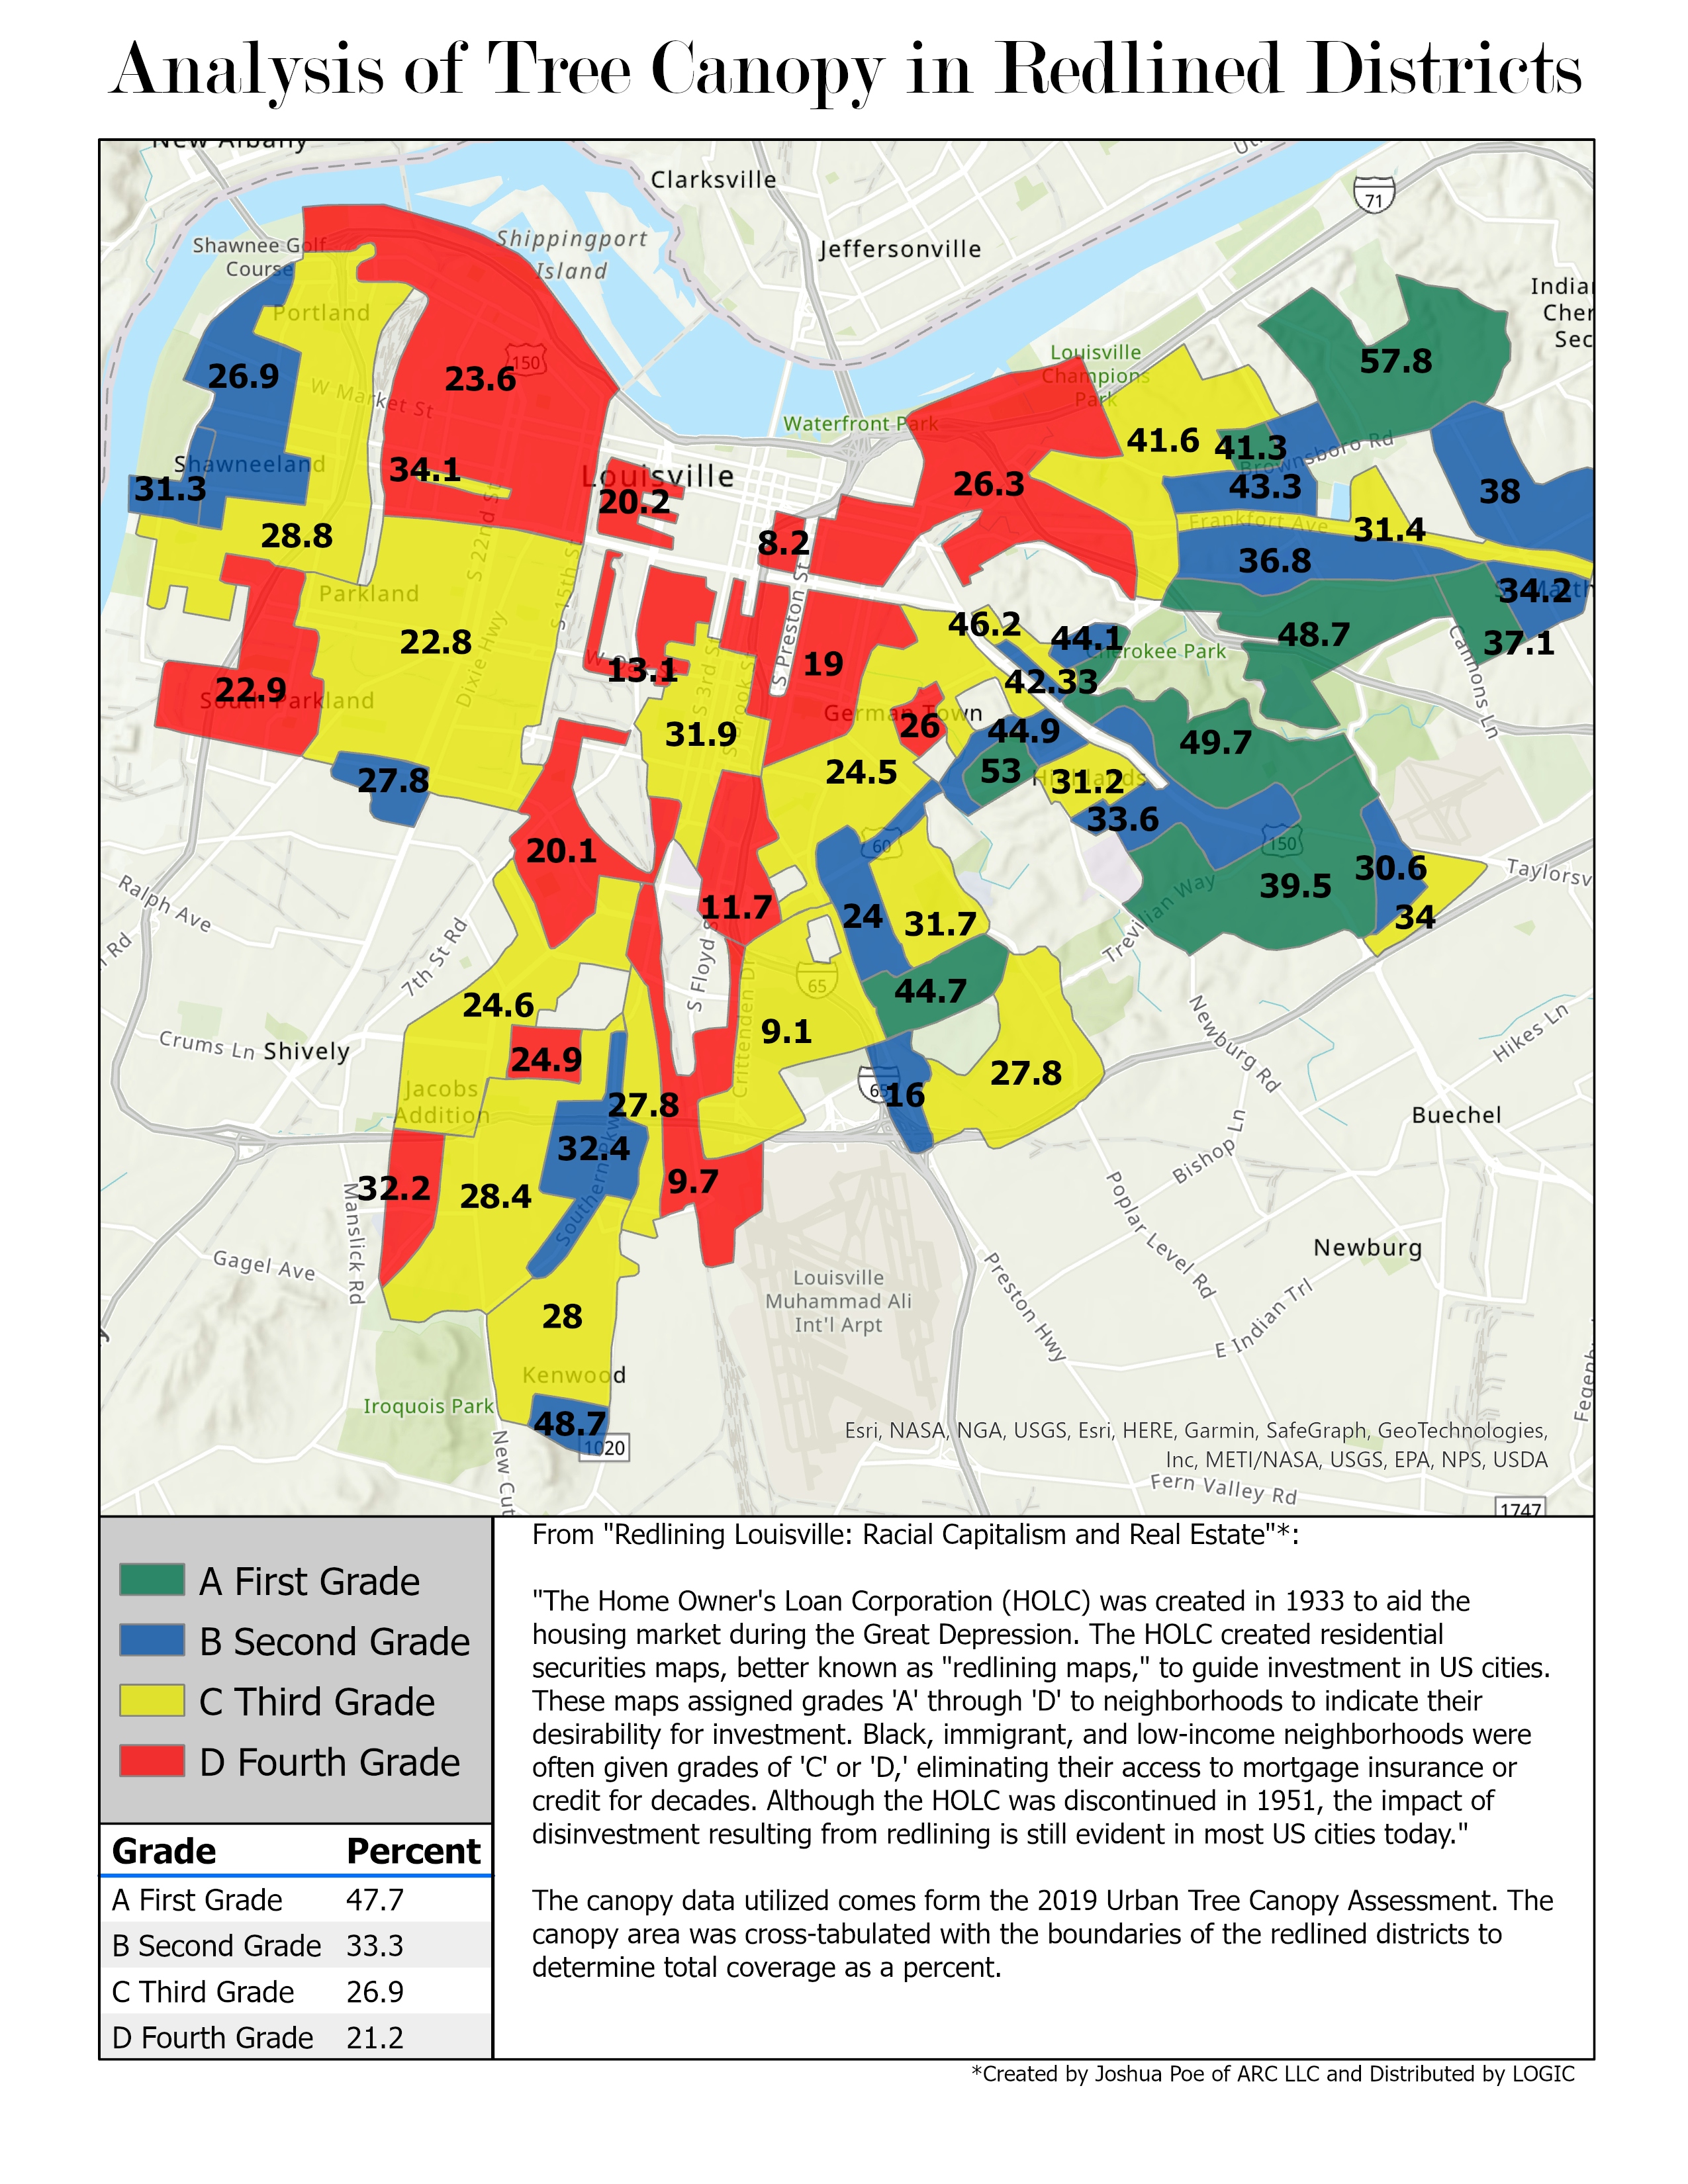
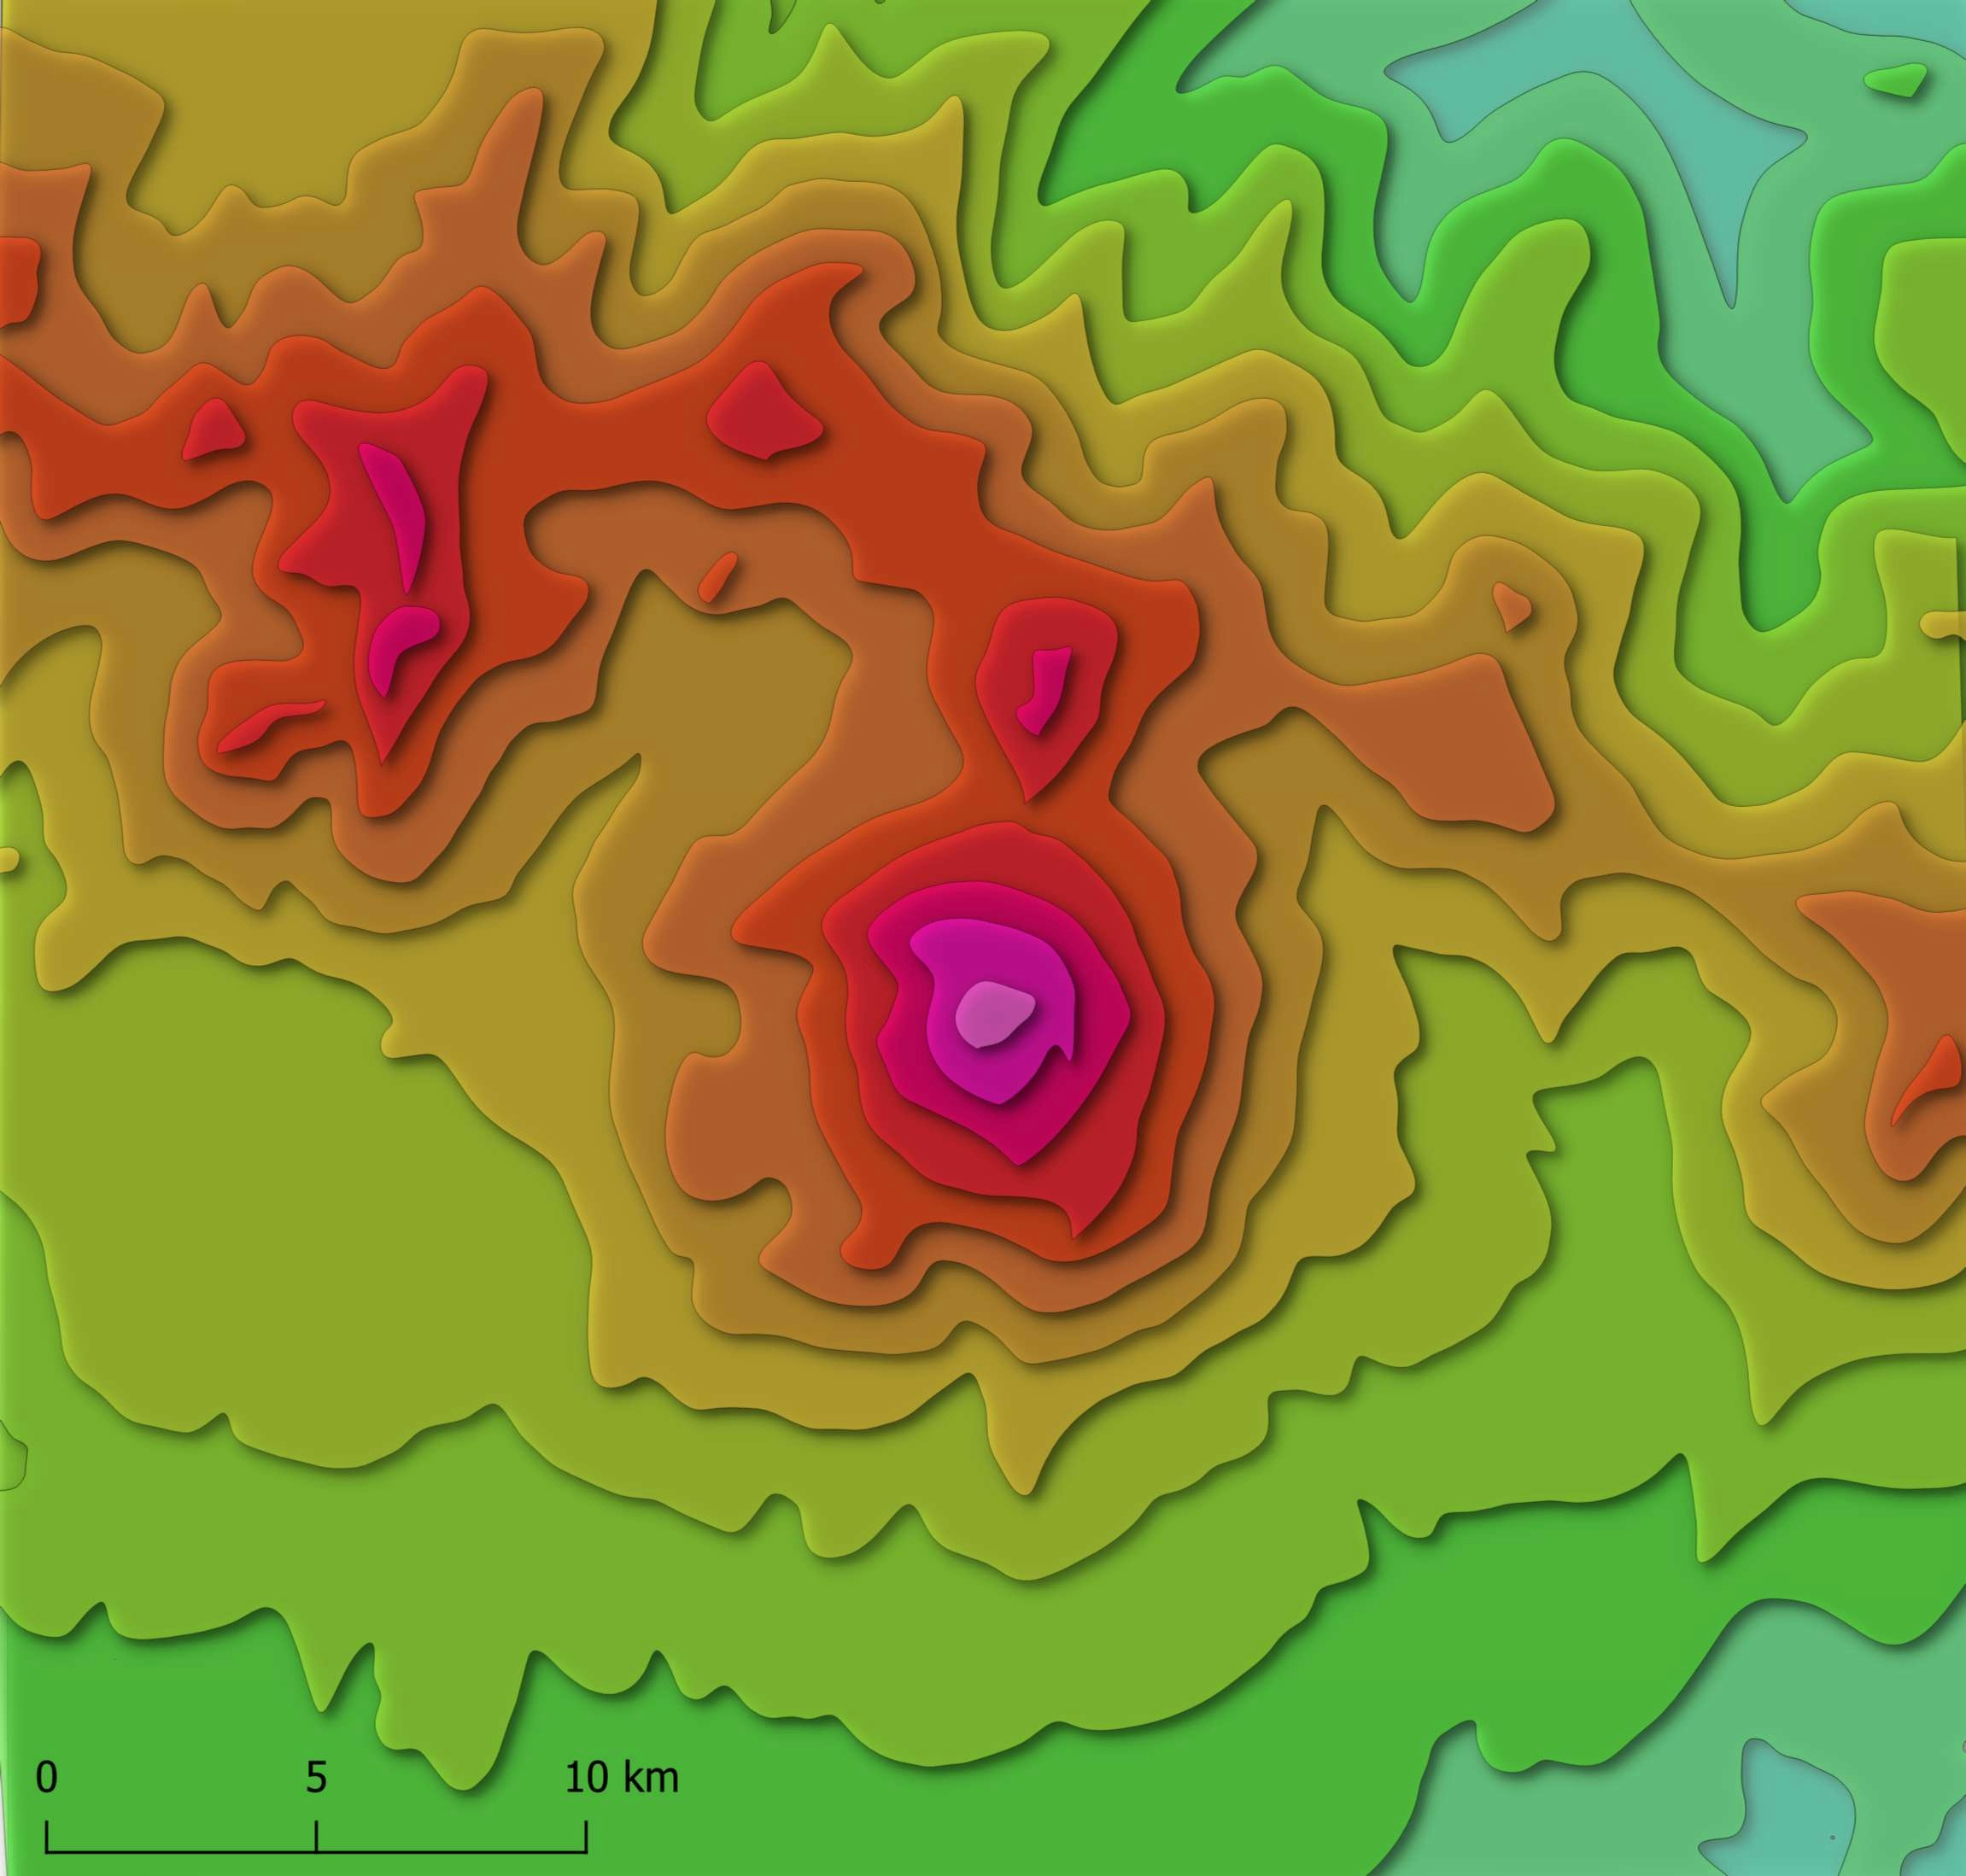
Originally this is three separate layouts made for social media, but I compiled them into one here for brevity. One map contains tree canopy coverage in Louisville by census tract calculated using the 2019 Urban Tree Canopy Assessment. The second is heart severity by census tract based off data from ArcGIS online. These layers were then overlaid in a third map to show areas where heat or canopy were more prevalent, since they tend to have an inverse relationship.
Canopy Cover and Heat Severity
Tools used
ArcGIS OnlineArcGIS Pro
tags
canopylouisvilletreesUrban Heat Island
More by Sean Willis


You might also like


Join the community!
We're a place where geospatial professionals showcase their works and discover opportunities.